Parametric Analysis of a Double Shaft, Batch-Type Paddle Mixer Using the Discrete Element Method (DEM) (3)
3. Results and Discussion
The Plackett–Burman (P–B) Design of Experiments (DoE) is shown in Table 5. The outputs of the P–B DoE are presented by KPI 1, KPI 2, KPI 3 and KPI 4. The RSD–Time plots for all twelve simulations are presented in Figure 5. As can be seen, all simulations were carried out for 60 s except run 4 and 11, where they were continued for 150 and 120 s to ensure that a steady state was reached. The results of the P–B DoE were analysed using a Pareto plot in conjunction with an analysis of variance (ANOVA) analysis for each KPI individually. The former presents the factors' order of significance, while the latter shows the statistical significance of each factor separately. Usually, a p-value of 0.05, equivalent to a confidence interval (CI) of 95%, is used as a cut off to detect significant factors. However, a p-value of 0.1 is used in this study due to the fact that P–B DoE is not able to capture interactions between factors. In other words, the null hypothesis that the factor of interest does not have an effect on the response parameter can be rejected with 90% CI (or p < 0.1) .
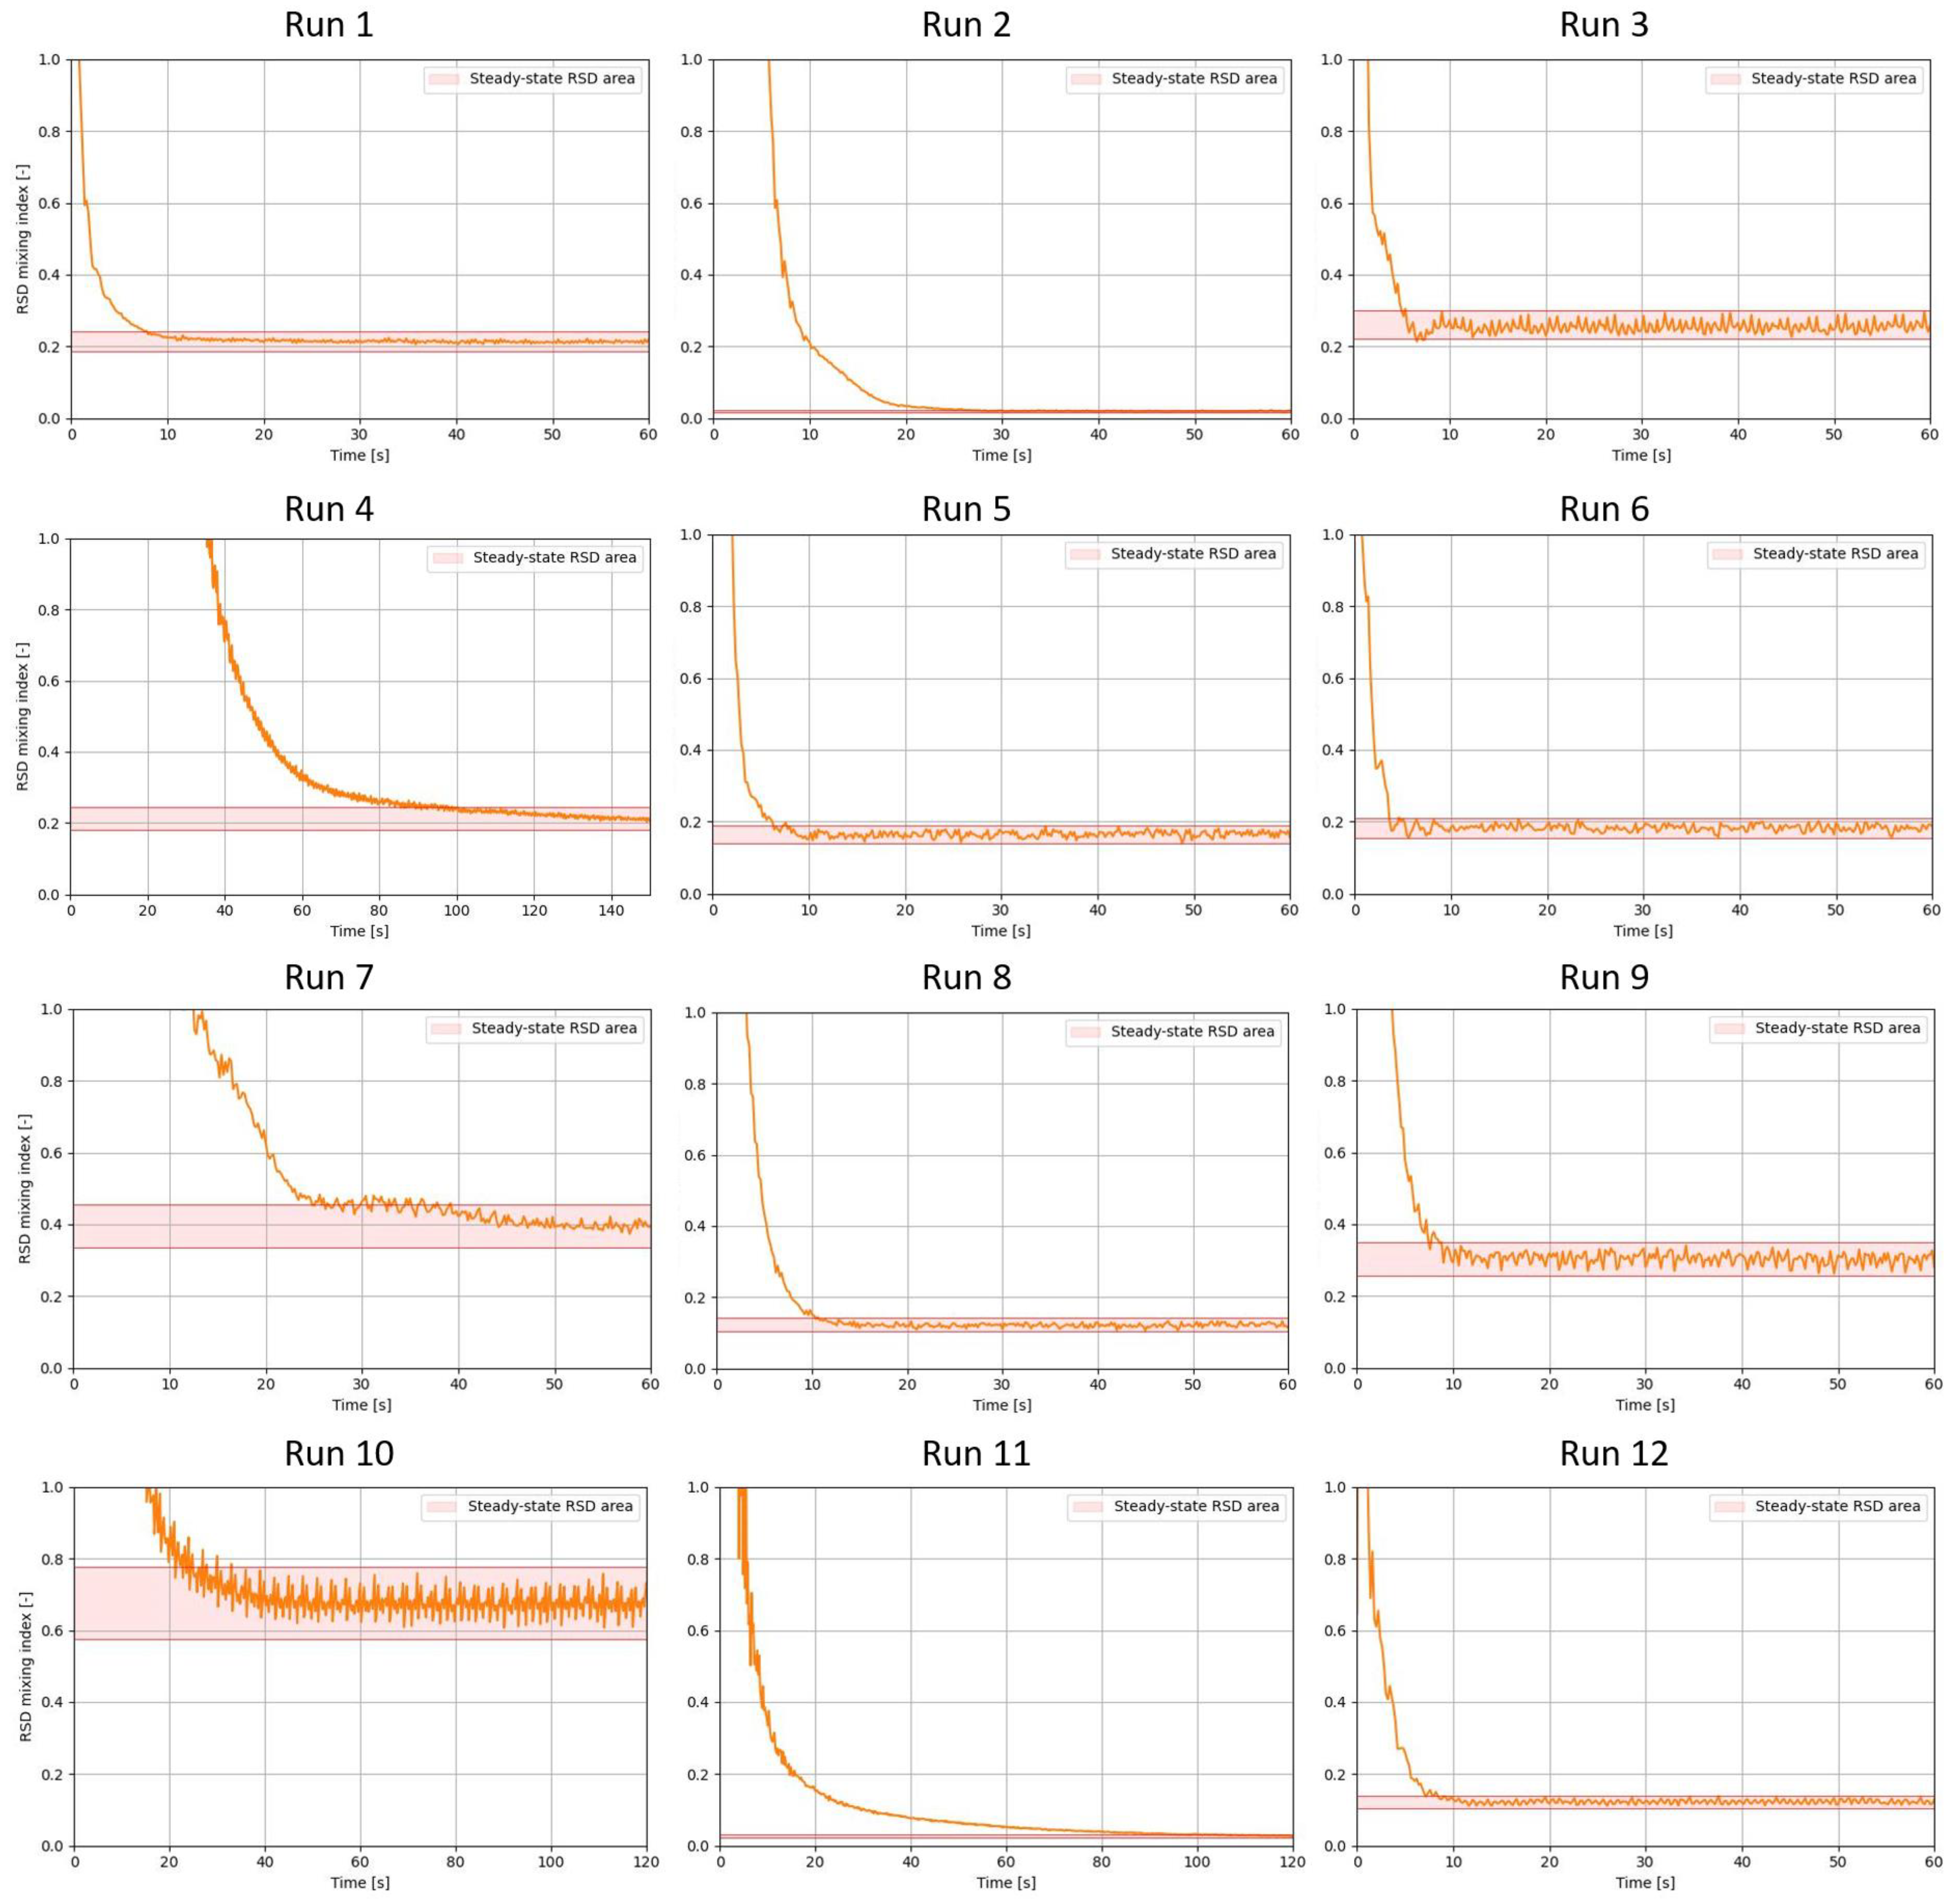
Figure 5. RSD–Time plots of all twelve runs as in Table 5.
Table 5. Plackett–Burman (P–B) design with the resulting key performance indicators (KPIs); KPI 1 = average steady-state relative standard deviation (RSD); KPI 2 = time required to reach a steady-state RSD; KPI 3 = average energy per second per kilogram over full mixing period; KPI 4 = required energy to reach a steady state RSD.
| Run | A | B | C | D | E | F | G | H | I | X1 | X2 | KPI 1 (-) | KPI 2 (s) | KPI 3 (W/kg) | KPI 4 (J/kg) |
| 1 | 1 | 1 | 1 | 1 | 1 | 1 | 1 | 1 | 1 | 1 | 1 | 0.213 | 8 | 43.4 | 62,550 |
| 2 | −1 | −1 | 1 | −1 | 1 | 1 | 1 | −1 | −1 | 1 | −1 | 0.02 | 26.8 | 49.9 | 457,408 |
| 3 | −1 | −1 | −1 | 1 | −1 | 1 | 1 | 1 | −1 | −1 | 1 | 0.261 | 7.6 | 42.5 | 47,529 |
| 4 | −1 | 1 | −1 | −1 | 1 | −1 | 1 | 1 | 1 | −1 | −1 | 0.212 | 140.0 * | 25 | 968,404 |
| 5 | 1 | −1 | 1 | −1 | −1 | 1 | −1 | 1 | 1 | −1 | −1 | 0.165 | 7.8 | 56 | 64,200 |
| 6 | 1 | −1 | −1 | 1 | −1 | −1 | 1 | −1 | 1 | 1 | −1 | 0.182 | 5.8 | 24.1 | 20,576 |
| 7 | 1 | −1 | −1 | −1 | 1 | −1 | −1 | 1 | −1 | 1 | 1 | 0.395 | 50 * | 22 | 375,731 |
| 8 | −1 | 1 | −1 | −1 | −1 | 1 | −1 | −1 | 1 | 1 | 1 | 0.124 | 10.8 | 59 | 75,879 |
| 9 | 1 | 1 | 1 | −1 | −1 | −1 | 1 | −1 | −1 | −1 | 1 | 0.304 | 9 | 15.6 | 10,777 |
| 10 | −1 | 1 | 1 | 1 | −1 | −1 | −1 | 1 | −1 | 1 | −1 | 0.679 | 40 * | 12 | 36,812 |
| 11 | −1 | −1 | 1 | 1 | 1 | −1 | −1 | −1 | 1 | −1 | 1 | 0.028 | 100 | 25.4 | 867,287 |
| 12 | 1 | 1 | −1 | 1 | 1 | 1 | −1 | −1 | −1 | −1 | −1 | 0.122 | 8.4 | 49 | 113,798 |
| * Manually determined values. | |||||||||||||||
3.1 KPI 1: Mixing Quality
Figure 6 presents the Pareto plot of the P–B analysis of KPI 1, which shows the order of factors' significance on the steady-state RSD value. The blue line denotes the accumulation of the total effect and the dashed lines in the bars denote a positive (+) or negative (−) correlation with the respective KPI. As for the small bars in the Pareto plot, the dashed lines are not visible, for each KPI an extra figure is added, indicating the main effect of factors on the respective KPI. As can be seen, the paddle angle has the largest effect on KPI 1 followed by the impeller rotational speed, paddle number and fill level. The ANOVA results presented in Table 6 show the factor's significance. The R squared value indicates an accurate fit with the obtained data. Considering the cut off value of 0.1 for the p-value, only the paddle angle has a significant effect and is positively correlated with KPI 1.
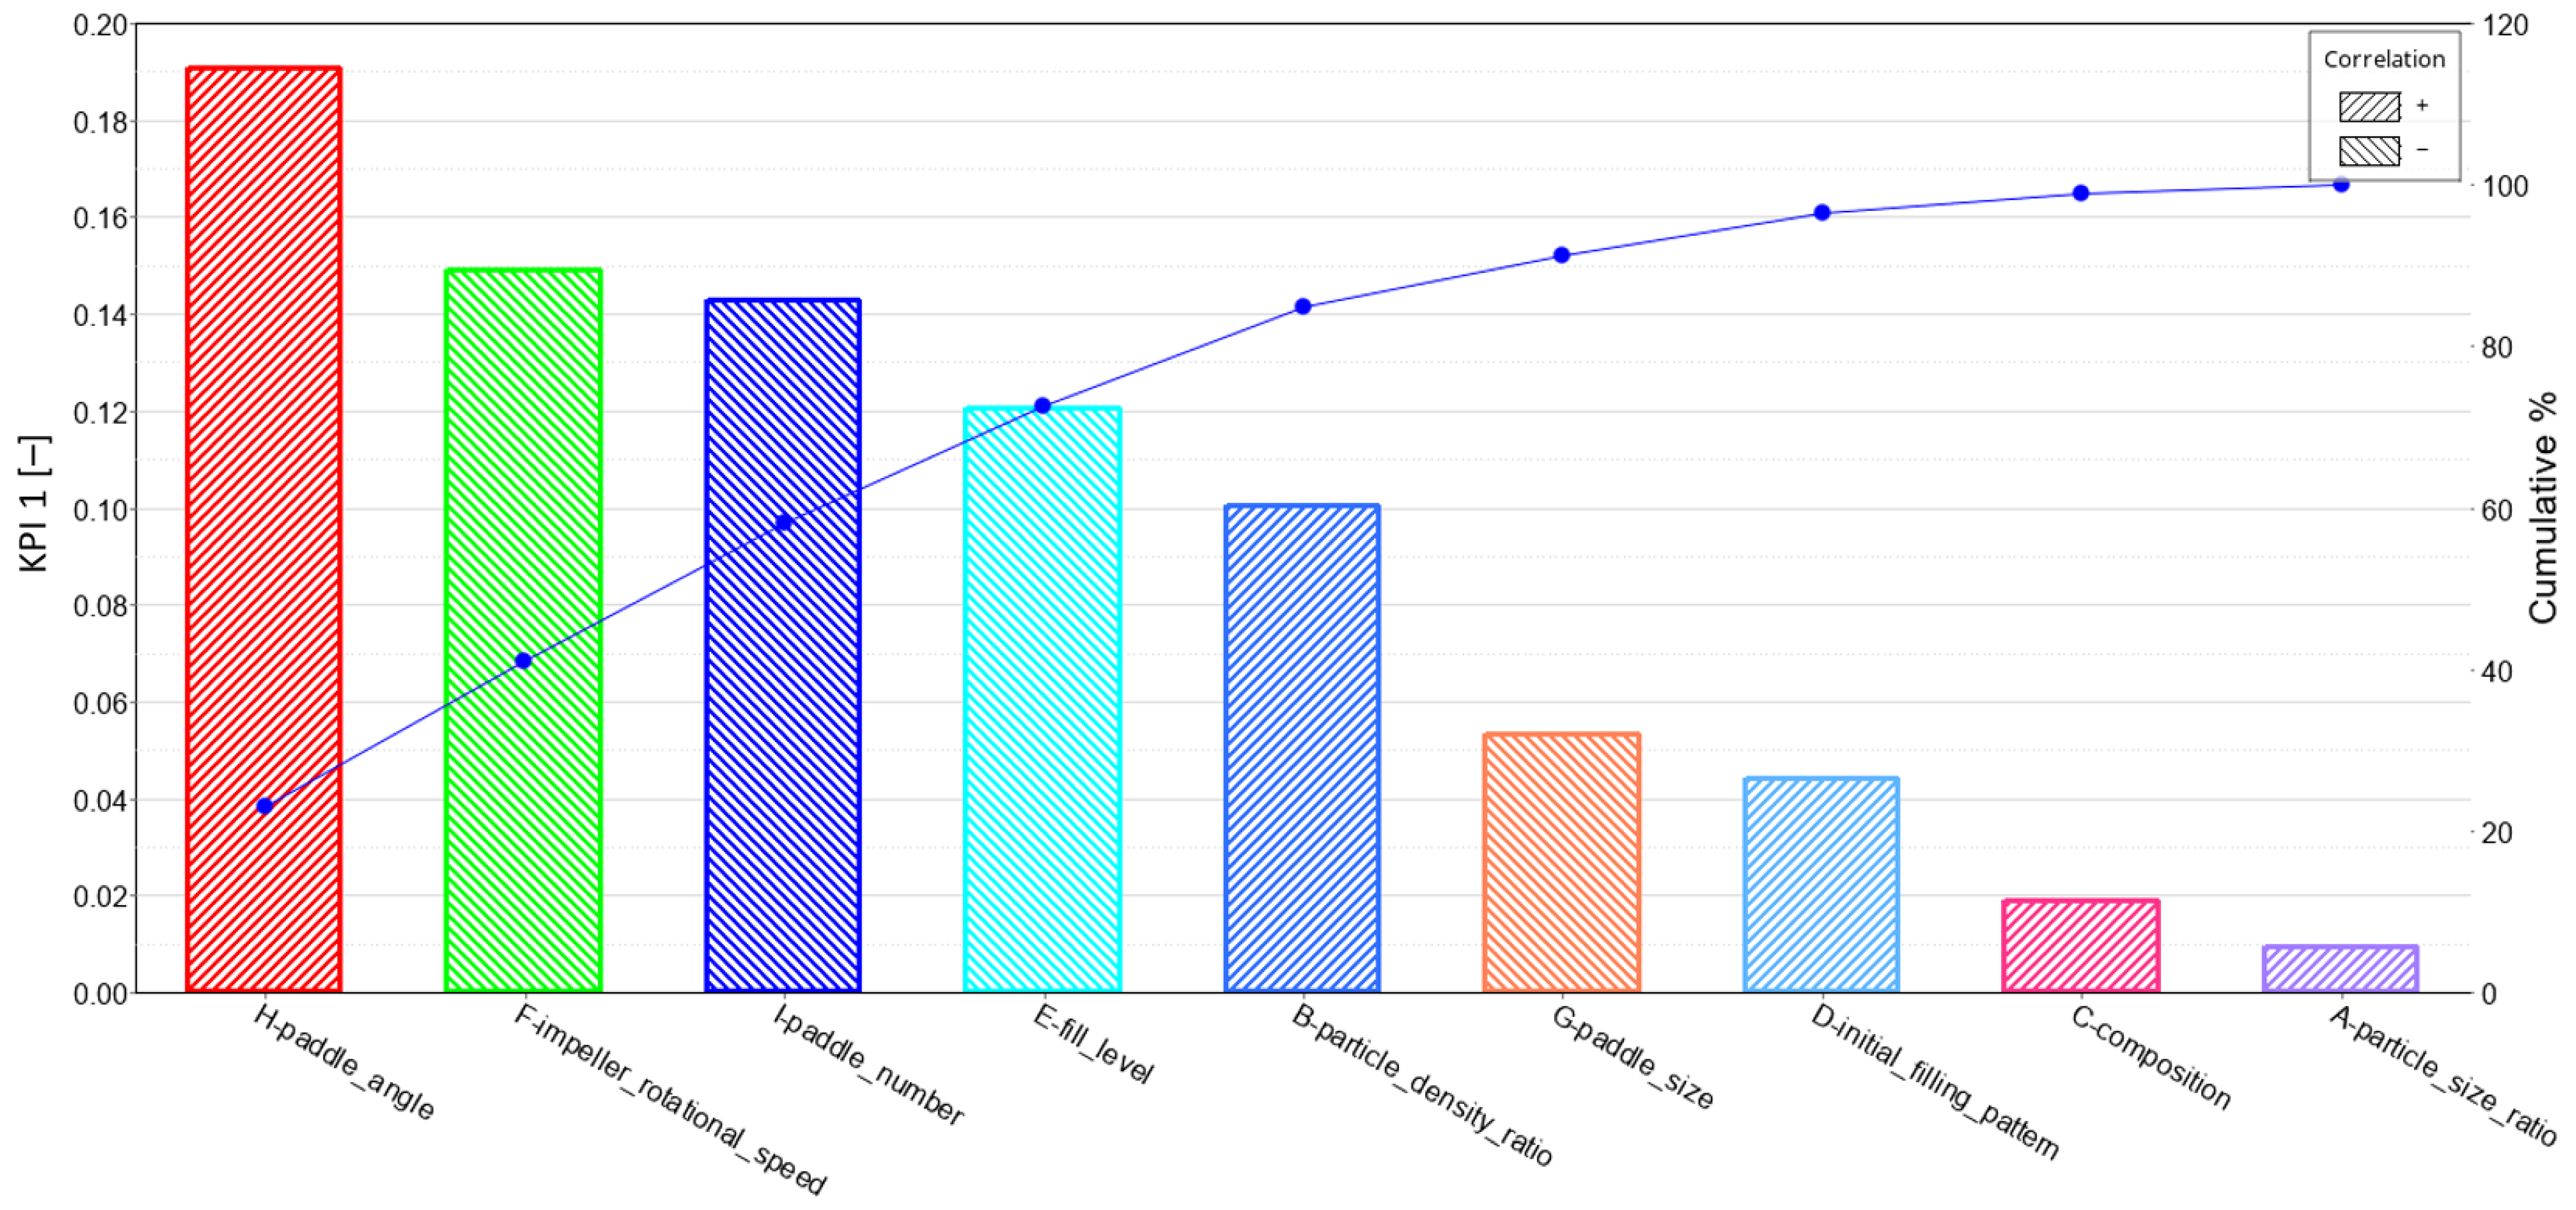
Table 6. Analysis of variance (ANOVA) results of KPI 1 mixing quality.
| Factor | Description | Sum of Squares | F-Value | p-Value | Order of Significance |
| A | Particle size ratio | 2.71 × 10⁻⁴ | 0.0236751 | 0.8918379 | 9 |
| B | Particle density ratio | 0.0303008 | 2.6495741 | 0.2451139 | 5 |
| C | Composition | 0.0010641 | 0.0930461 | 0.7891567 | 8 |
| D | Initial filling pattern | 0.0058521 | 0.5117209 | 0.5486319 | 7 |
| E | Fill level | 0.0438021 | 3.8301648 | 0.1894715 | 4 |
| F | Impeller rotational speed | 0.0667521 | 5.8369707 | 0.1369824 | 2 |
| G | Paddle size | 0.0085868 | 0.7508471 | 0.4775527 | 6 |
| H | Paddle angle | 0.1092521 | 9.553278 | 0.0906657 | 1 |
| I | Paddle number | 0.0612041 | 5.3518396 | 0.1467947 | 3 |
| Total | 0.3499569 | ||||
| R2 = 0.9346429 | |||||
Furthermore, Figure 7 shows the negatively correlated fill level, impeller rotational speed and paddle number meaning that an increase in these factors leads to a decrease in KPI 1 (thus an improvement in mixing quality).
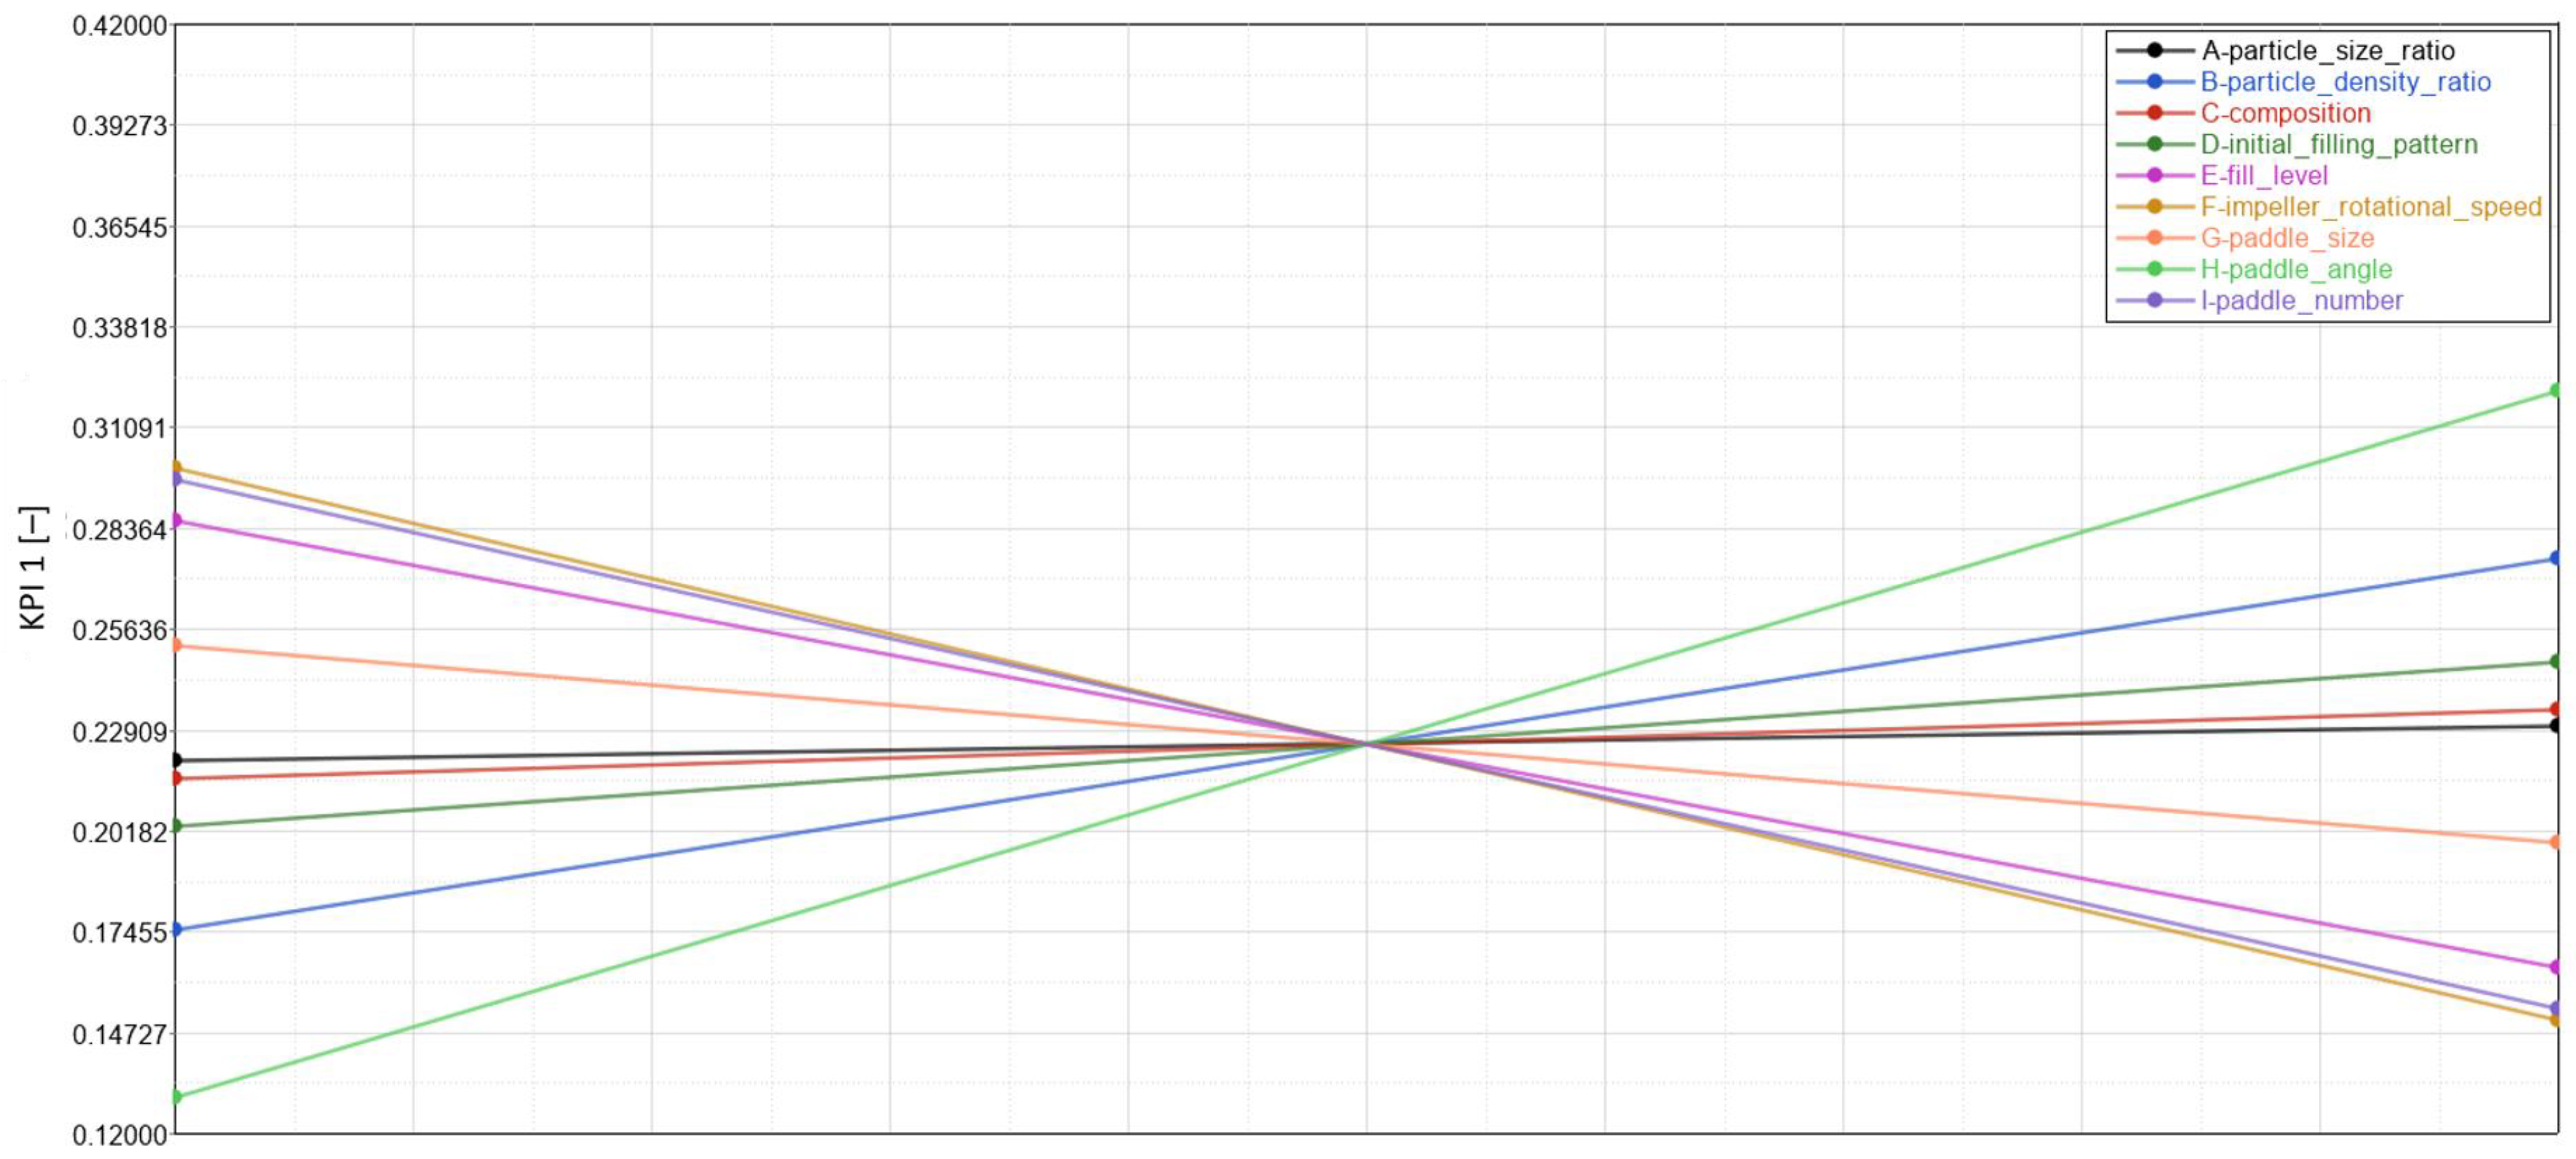
Figure 7. Main effect of factors on KPI 1 mixing quality.
On the contrary, the paddle angle shows a positive correlation, which means that an increase in paddle angle leads to an increase in KPI 1 (thus a deterioration in the mixing quality). The material properties have a minor effect on the mixing quality, while the operational conditions and geometric parameters have a relatively significant role in this measure of mixing performance.
A comparison with the literature shows at first sight inconclusive results. Studies on other types of mixers showed the importance of the impeller configuration in terms of paddle angle in a single-shaft paddle mixer, and showed that the initial filling pattern does not significantly influence the mix quality for a single-shaft paddle mixer and for a ploughshare mixer.
For the double-paddle mixer, Jadidi et al. found that the initial filling pattern does have an effect on the mixing performance. However, this is in contrast with the results of this research, where we show that the initial filling pattern has no significant effect on the mixing index (KPI 1). This can be explained by the differences in paddle angles in both studies. In this study, the angled paddles cause particle dispersion in both the radial and axial directions, while Jadidi et al. used paddles that are in line with the shaft, resulting in a very low axial dispersion.
3.2. KPI 2: Mixing Time
With respect to the time it takes for a steady-state RSD to be reached (KPI 2), the Pareto plot and ANOVA results are shown in Figure 8 and Table 7. The ANOVA results show none of the factors are significant over the others. Nevertheless, the Pareto plot presents the order of significance, with the impeller rotational speed affecting KPI 2 the most. In Figure 9, the main (linear) effect of the factors is shown on KPI 2. Considering only the first few factors in the order of significance, the particle size ratio and impeller rotational speed are negatively correlated with KPI2, while the fill level is positively correlated. The increase in impeller rotational speed results in reaching the steady-state RSD faster (Figure 9), which is in line with the literature on double-shaft paddle mixers. However, Qi et al. investigated a double shaft, lab-scale screw mixer and found that the screw’s rotational speed did not affect the mixing time nor the mixing quality with a constant fill level and screw pitch.
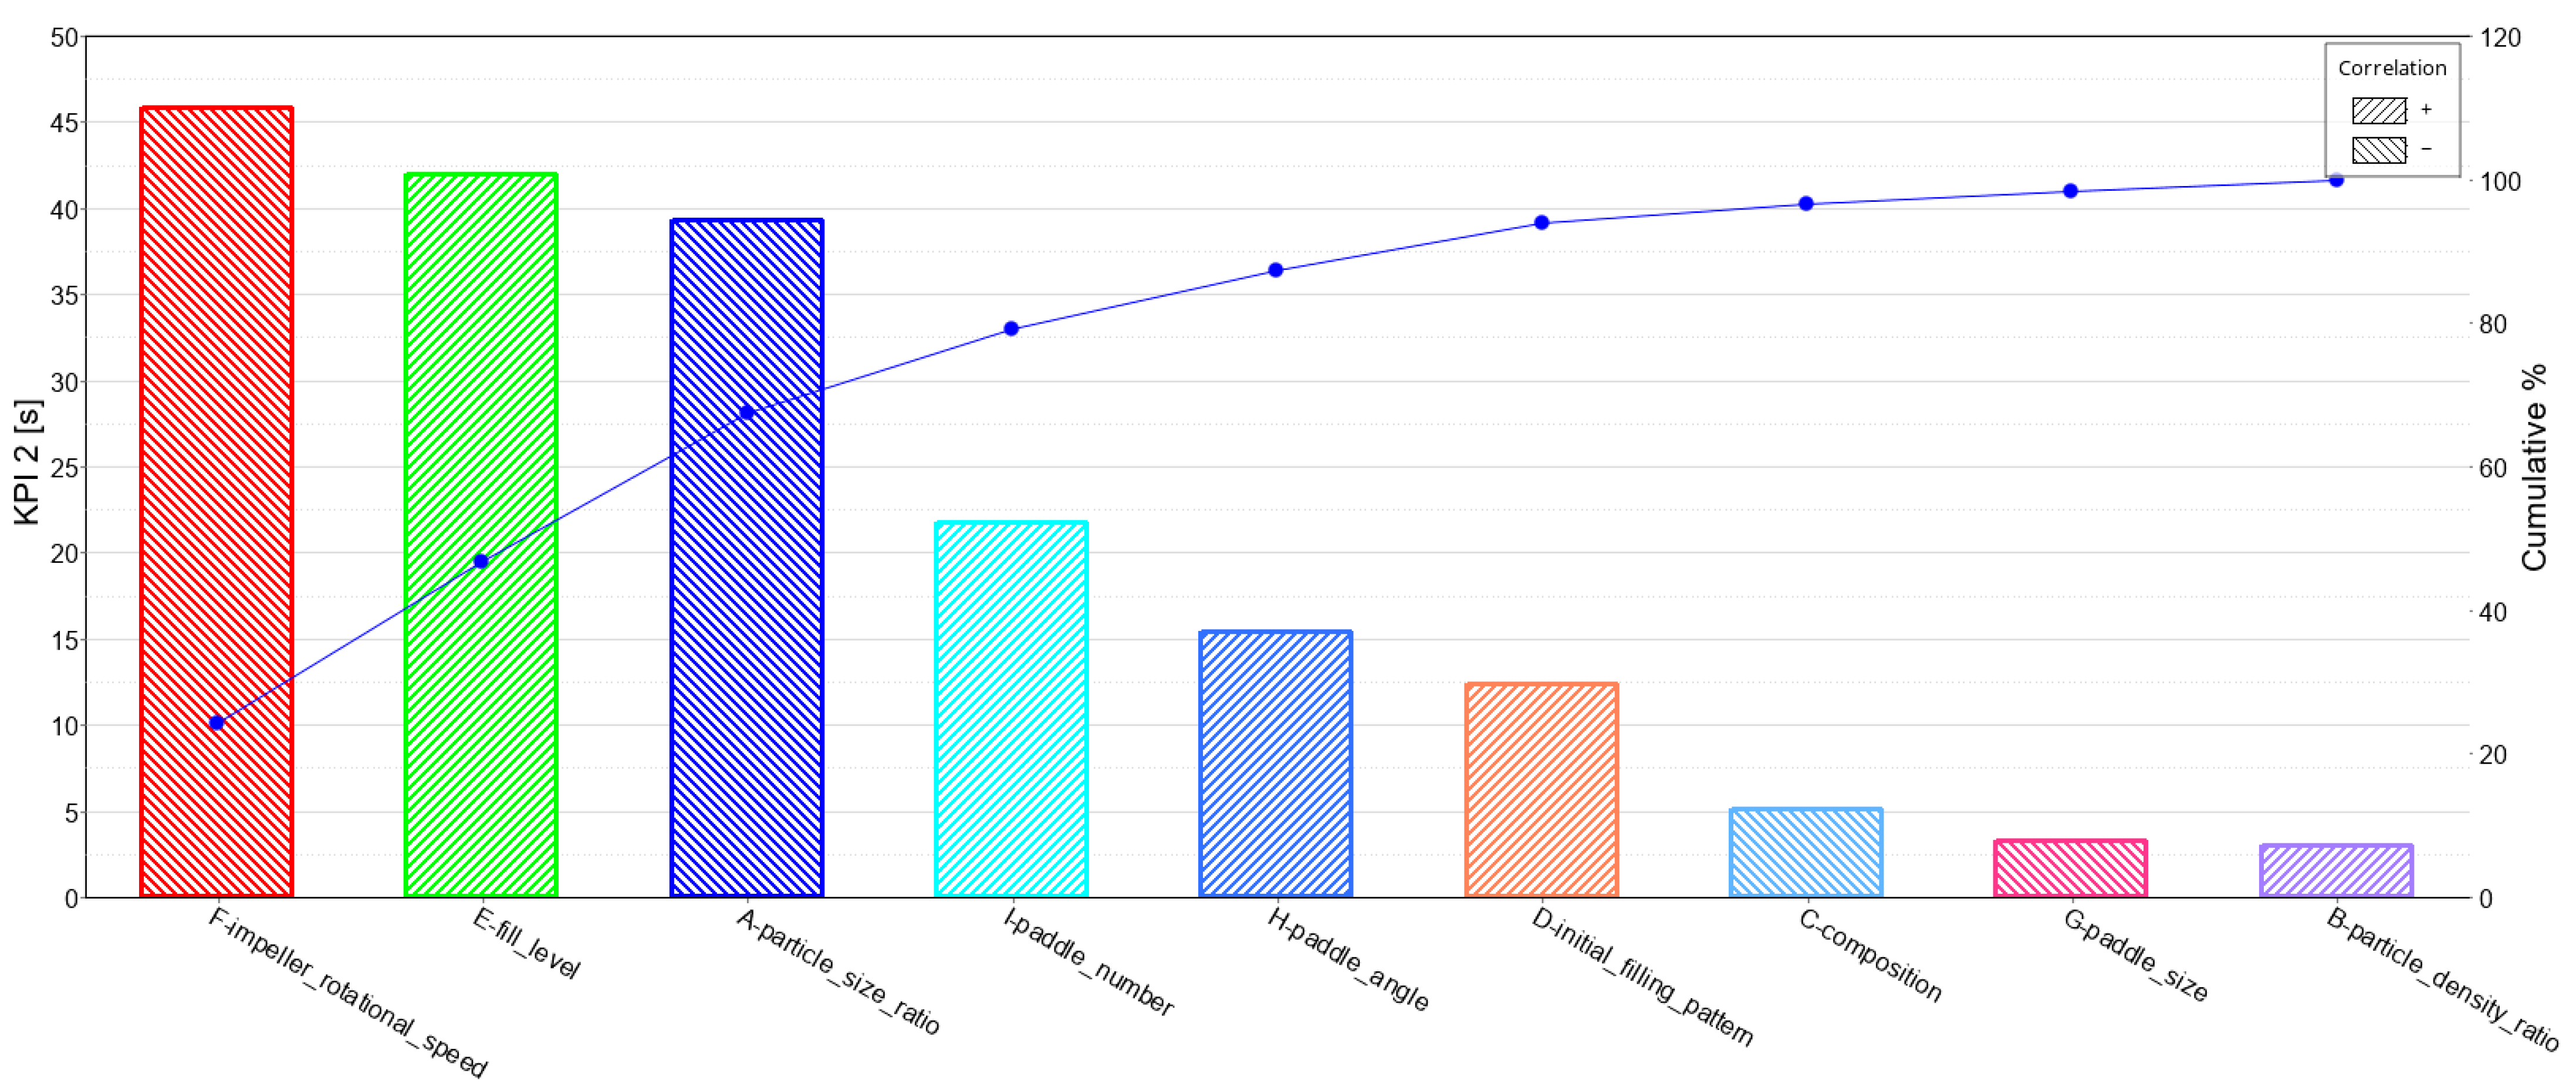
Figure 8.Pareto plot for KPI 2 mixing time.
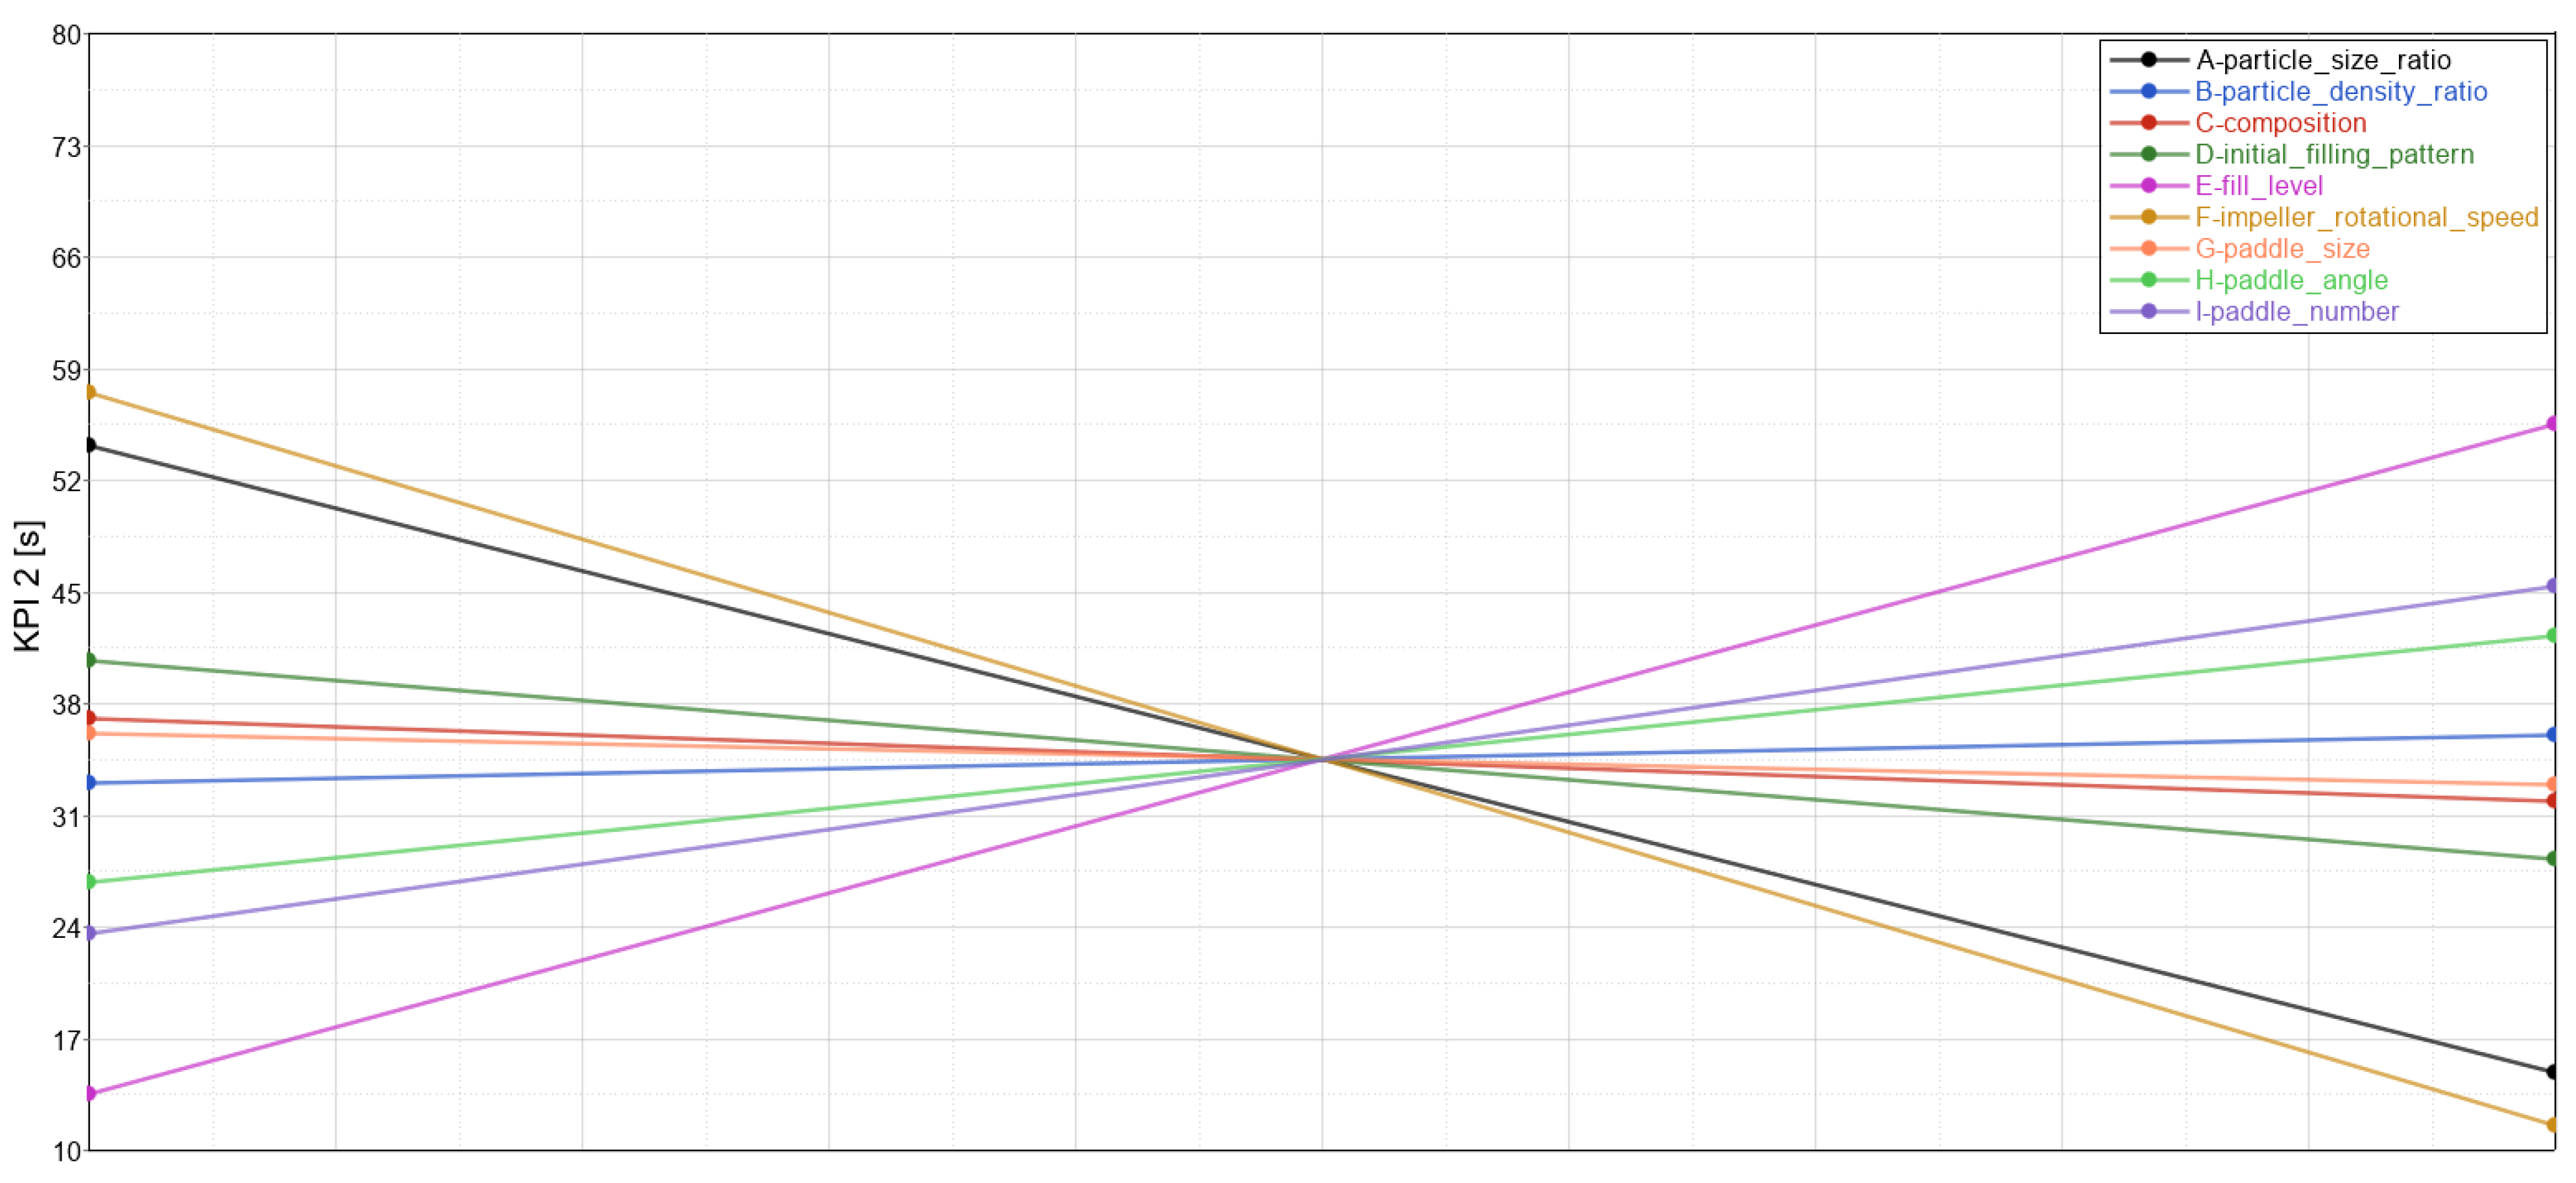
Figure 9. The main effect of factors on KPI 2 mixing time.
| Factor | Description | Sum of Squares | F-Value | p-Value | Order of Significance |
| A | Particle size ratio | 4649.2033 | 5.8268239 | 0.1371741 | 3 |
| B | Particle density ratio | 27.603333 | 0.0345951 | 0.8696027 | 9 |
| C | Composition | 80.083333 | 0.1003681 | 0.7814001 | 7 |
| D | Initial filling pattern | 463.76333 | 0.5812323 | 0.5254726 | 6 |
| E | Fill level | 5300.4033 | 6.6429696 | 0.1233028 | 2 |
| F | Impeller rotational speed | 6320.43 | 7.9213641 | 0.1064594 | 1 |
| G | Paddle size | 32.67 | 0.0409452 | 0.8583601 | 8 |
| H | Paddle angle | 714.56333 | 0.8955587 | 0.4438642 | 5 |
| I | Paddle number | 1421.3633 | 1.7813877 | 0.3136374 | 4 |
| Total | 20,605.88 | ||||
| R2 = 0.9225564 |
Furthermore, according to Jadidi et al., the fill level had no significant effect on the mixing performance. On the contrary, a study by Alian et al. on a single-shaft ploughshare mixer showed that the fill level had an effect on the mixing time. They stated that it was due to the difference in free space for the particles to move through in the agitated vessel. This research shows that the fill level has a positive correlation with KPI 2; thus, increasing the fill level leads to an increase in KPI 2. In other words, the time it takes to reach a steady-state RSD increases with an increase in the fill level.
3.3. KPI 3: Average Mixing Power Per Kilogram
This KPI (as well as KPI 4) has been formulated to examine the performance of the mixer with respect to sustainability. To the best of the authors’ knowledge, there is no research work exploring the energy efficiency of paddle mixers. Having a deep understanding of the main factors influencing the energy consumption of paddle mixers paves the way for optimising this device from an environmental point of view. KPI 3 was defined as the total energy consumed by the mixer normalised by the mixing time and mass of the materials. The results of the P–B design regarding KPI 3 are presented in Figure 10 and Table 8.
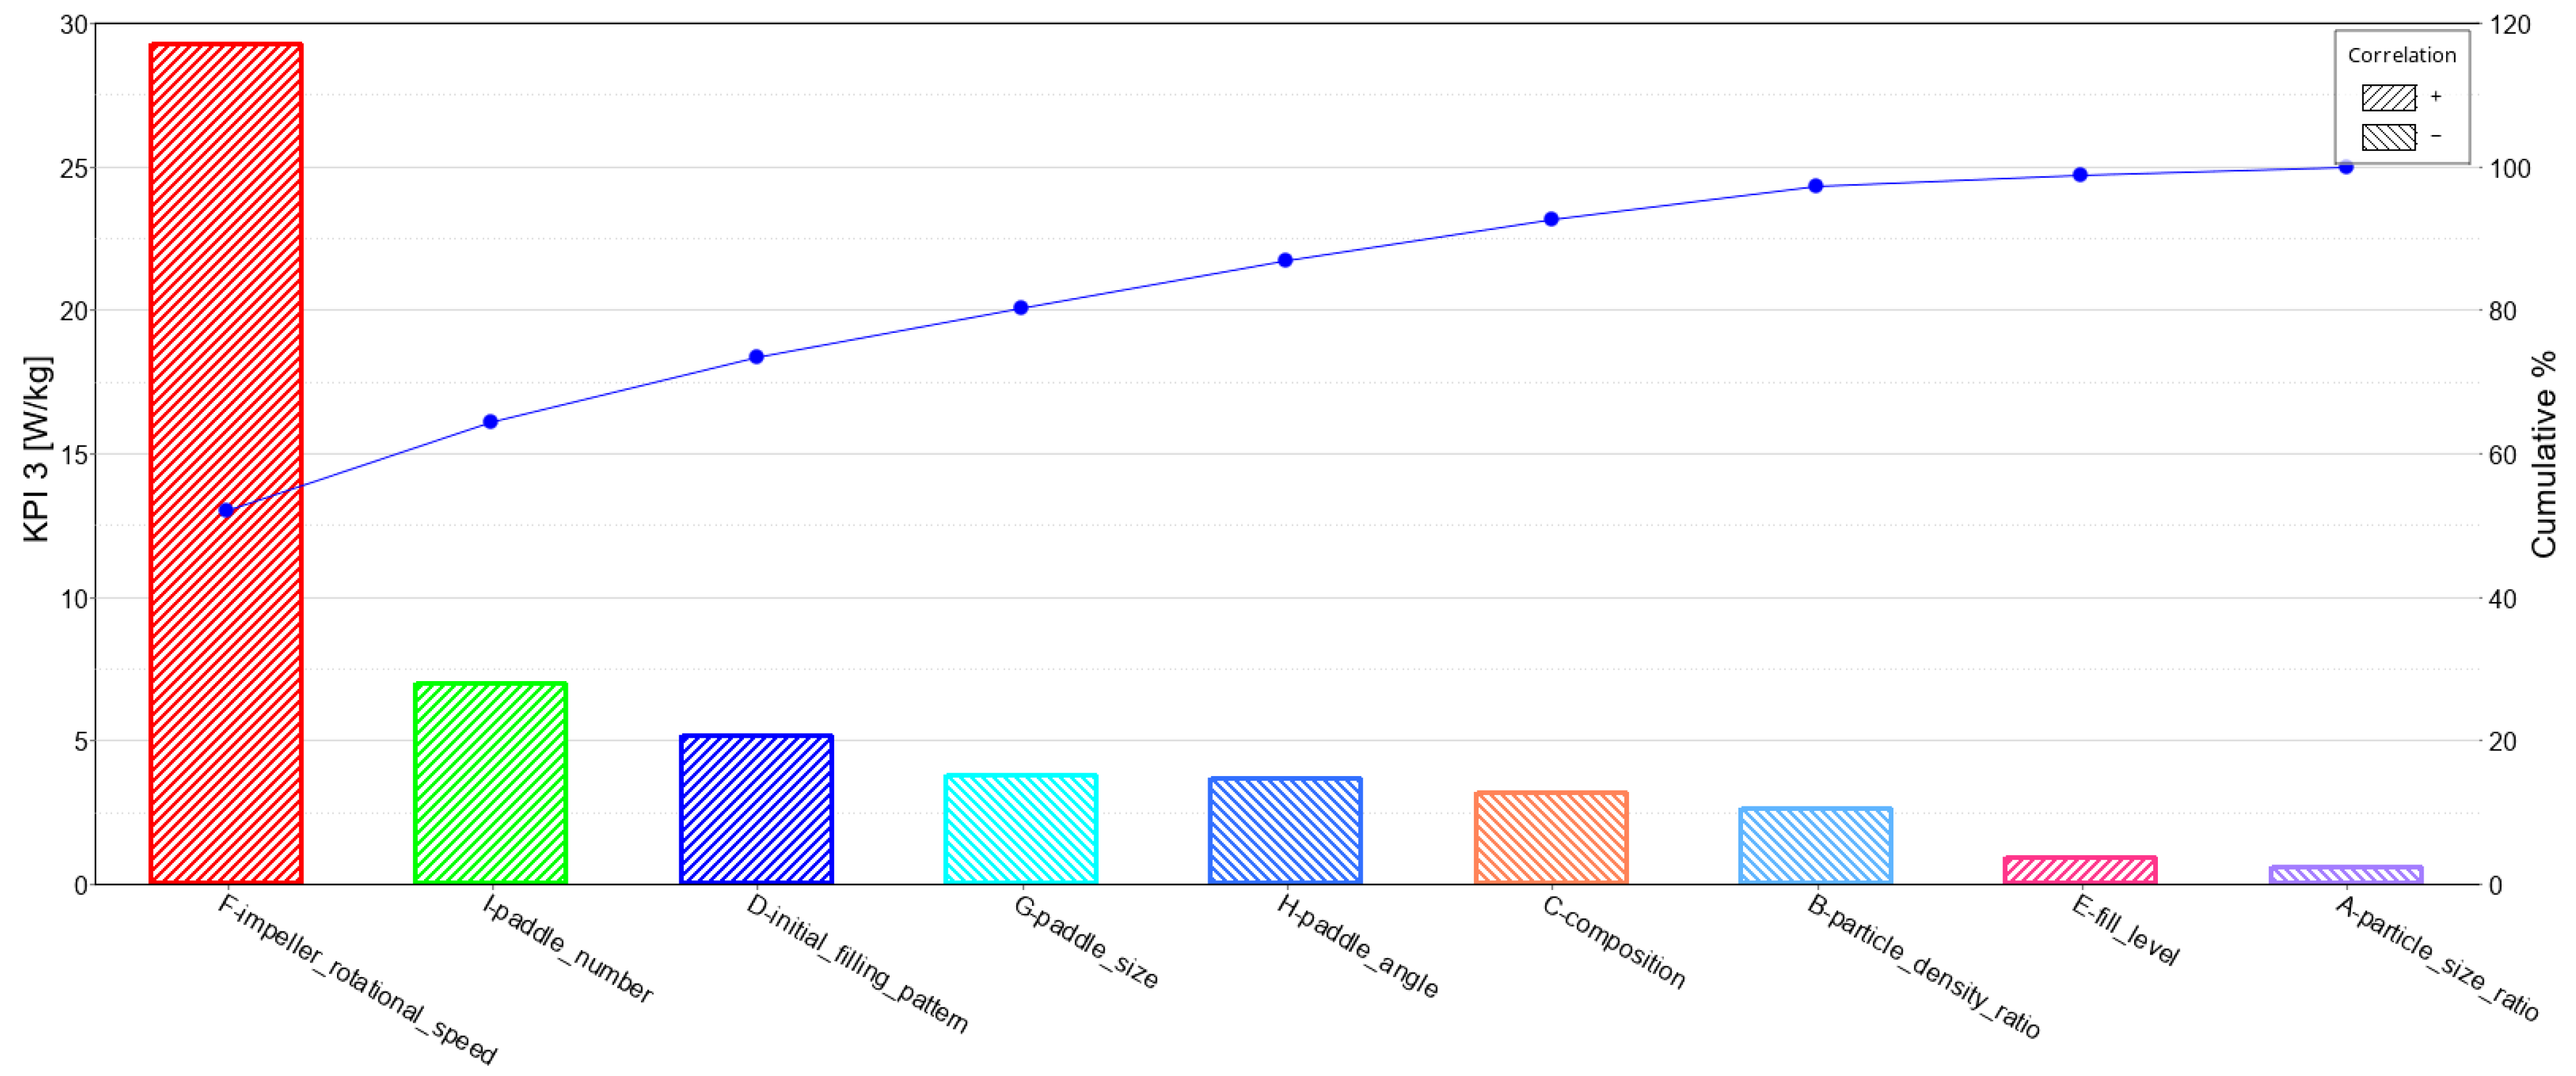
Table 8. Analysis of variance (ANOVA) results of KPI 3 average mixing power.
| Factor | Description | Sum of Squares | F-Value | p-Value | Order of Significance |
| A | Particle size ratio | 1.1408333 | 0.3639989 | 0.6076023 | 9 |
| B | Particle density ratio | 21.0675 | 6.7218825 | 0.1221095 | 7 |
| C | Composition | 31.040833 | 9.9040149 | 0.0878654 | 6 |
| D | Initial filling pattern | 80.600833 | 25.716831 | 0.0367546 | 3 |
| E | Fill level | 2.5208333 | 0.8043074 | 0.4644522 | 8 |
| F | Impeller rotational speed | 2572.5408 | 820.80537 | 0.0012161 | 1 |
| G | Paddle size | 43.700833 | 13.943366 | 0.064823 | 4 |
| H | Paddle angle | 40.700833 | 12.986174 | 0.0691167 | 5 |
| I | Paddle number | 146.30083 | 46.679341 | 0.020758 | 2 |
| Total | 2945.8825 | ||||
| R2 = 0.9978722 | |||||
Figure 10 clearly shows that the impeller rotational speed, as expected, has the biggest contribution to the energy consumption. Besides this factor, the ANOVA presented in Table 8 confirms the significance of the paddle number, initial filling pattern, paddle size, paddle angle and composition (considering a p-value < 0.1). This implies that while both operational and geometric parameters are essential for the energy efficiency of the mixer, the material properties have a small effect. In other words, one should put emphasis on operational and geometric parameters for the purpose of optimising the mixer with respect to energy consumption. For instance, based on Figure 11, it can be initially recommended to utilise a lower number of paddles with a bigger size and a higher angle to minimise the energy consumed by the mixer.
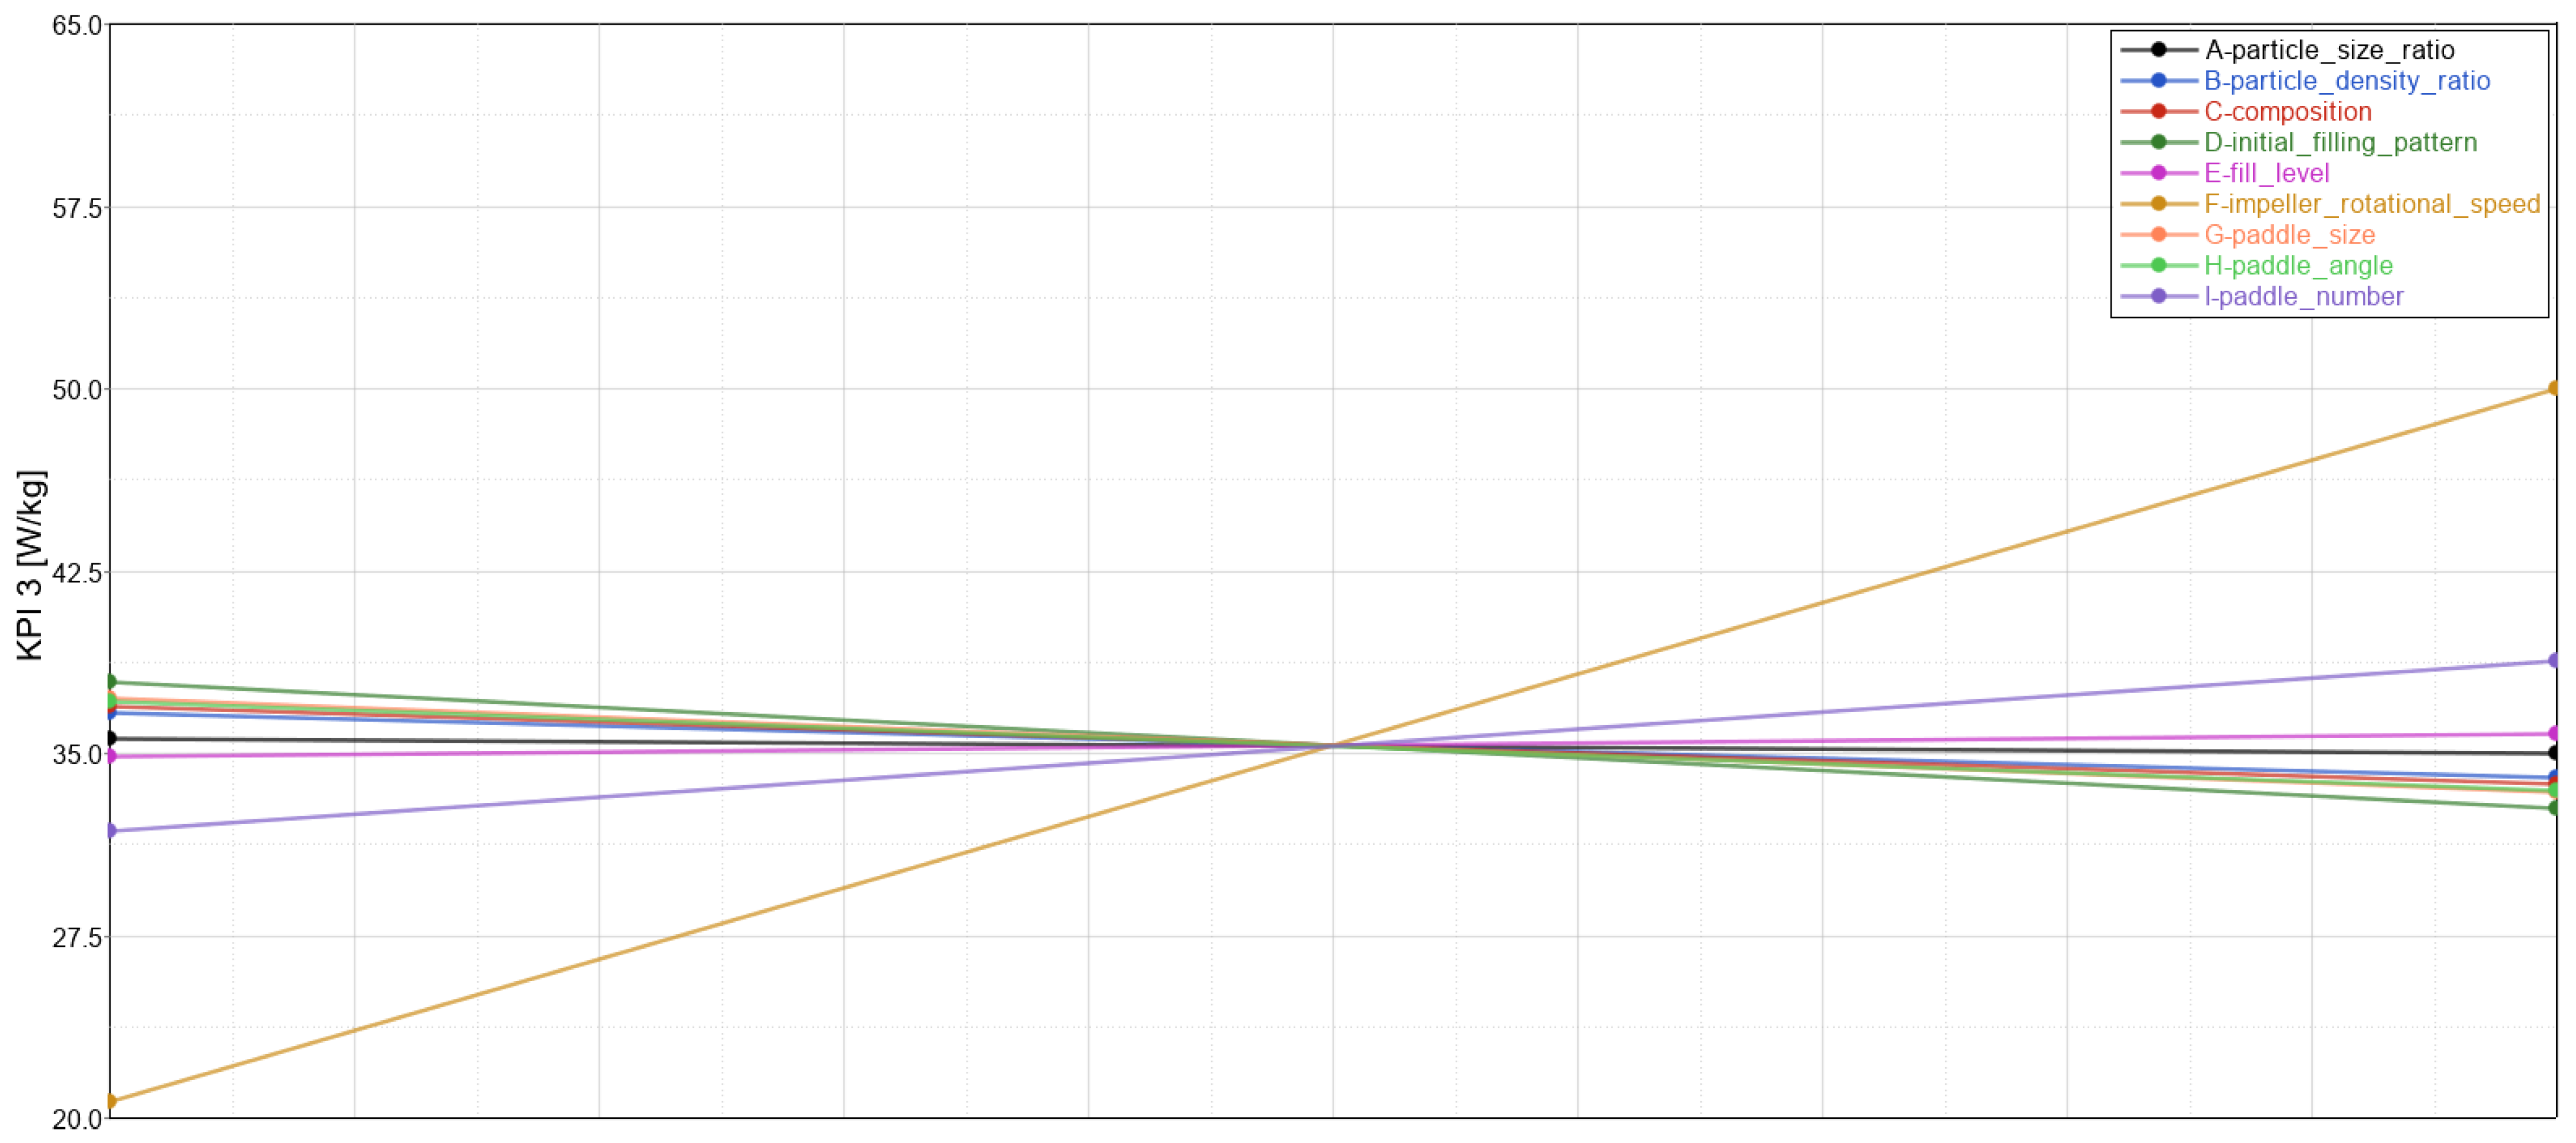
Figure 11.The main effect of factors on KPI 3 average mixing power.
3.4. KPI 4: Total Mixing Energy Required to Reach a Steady-State RSD
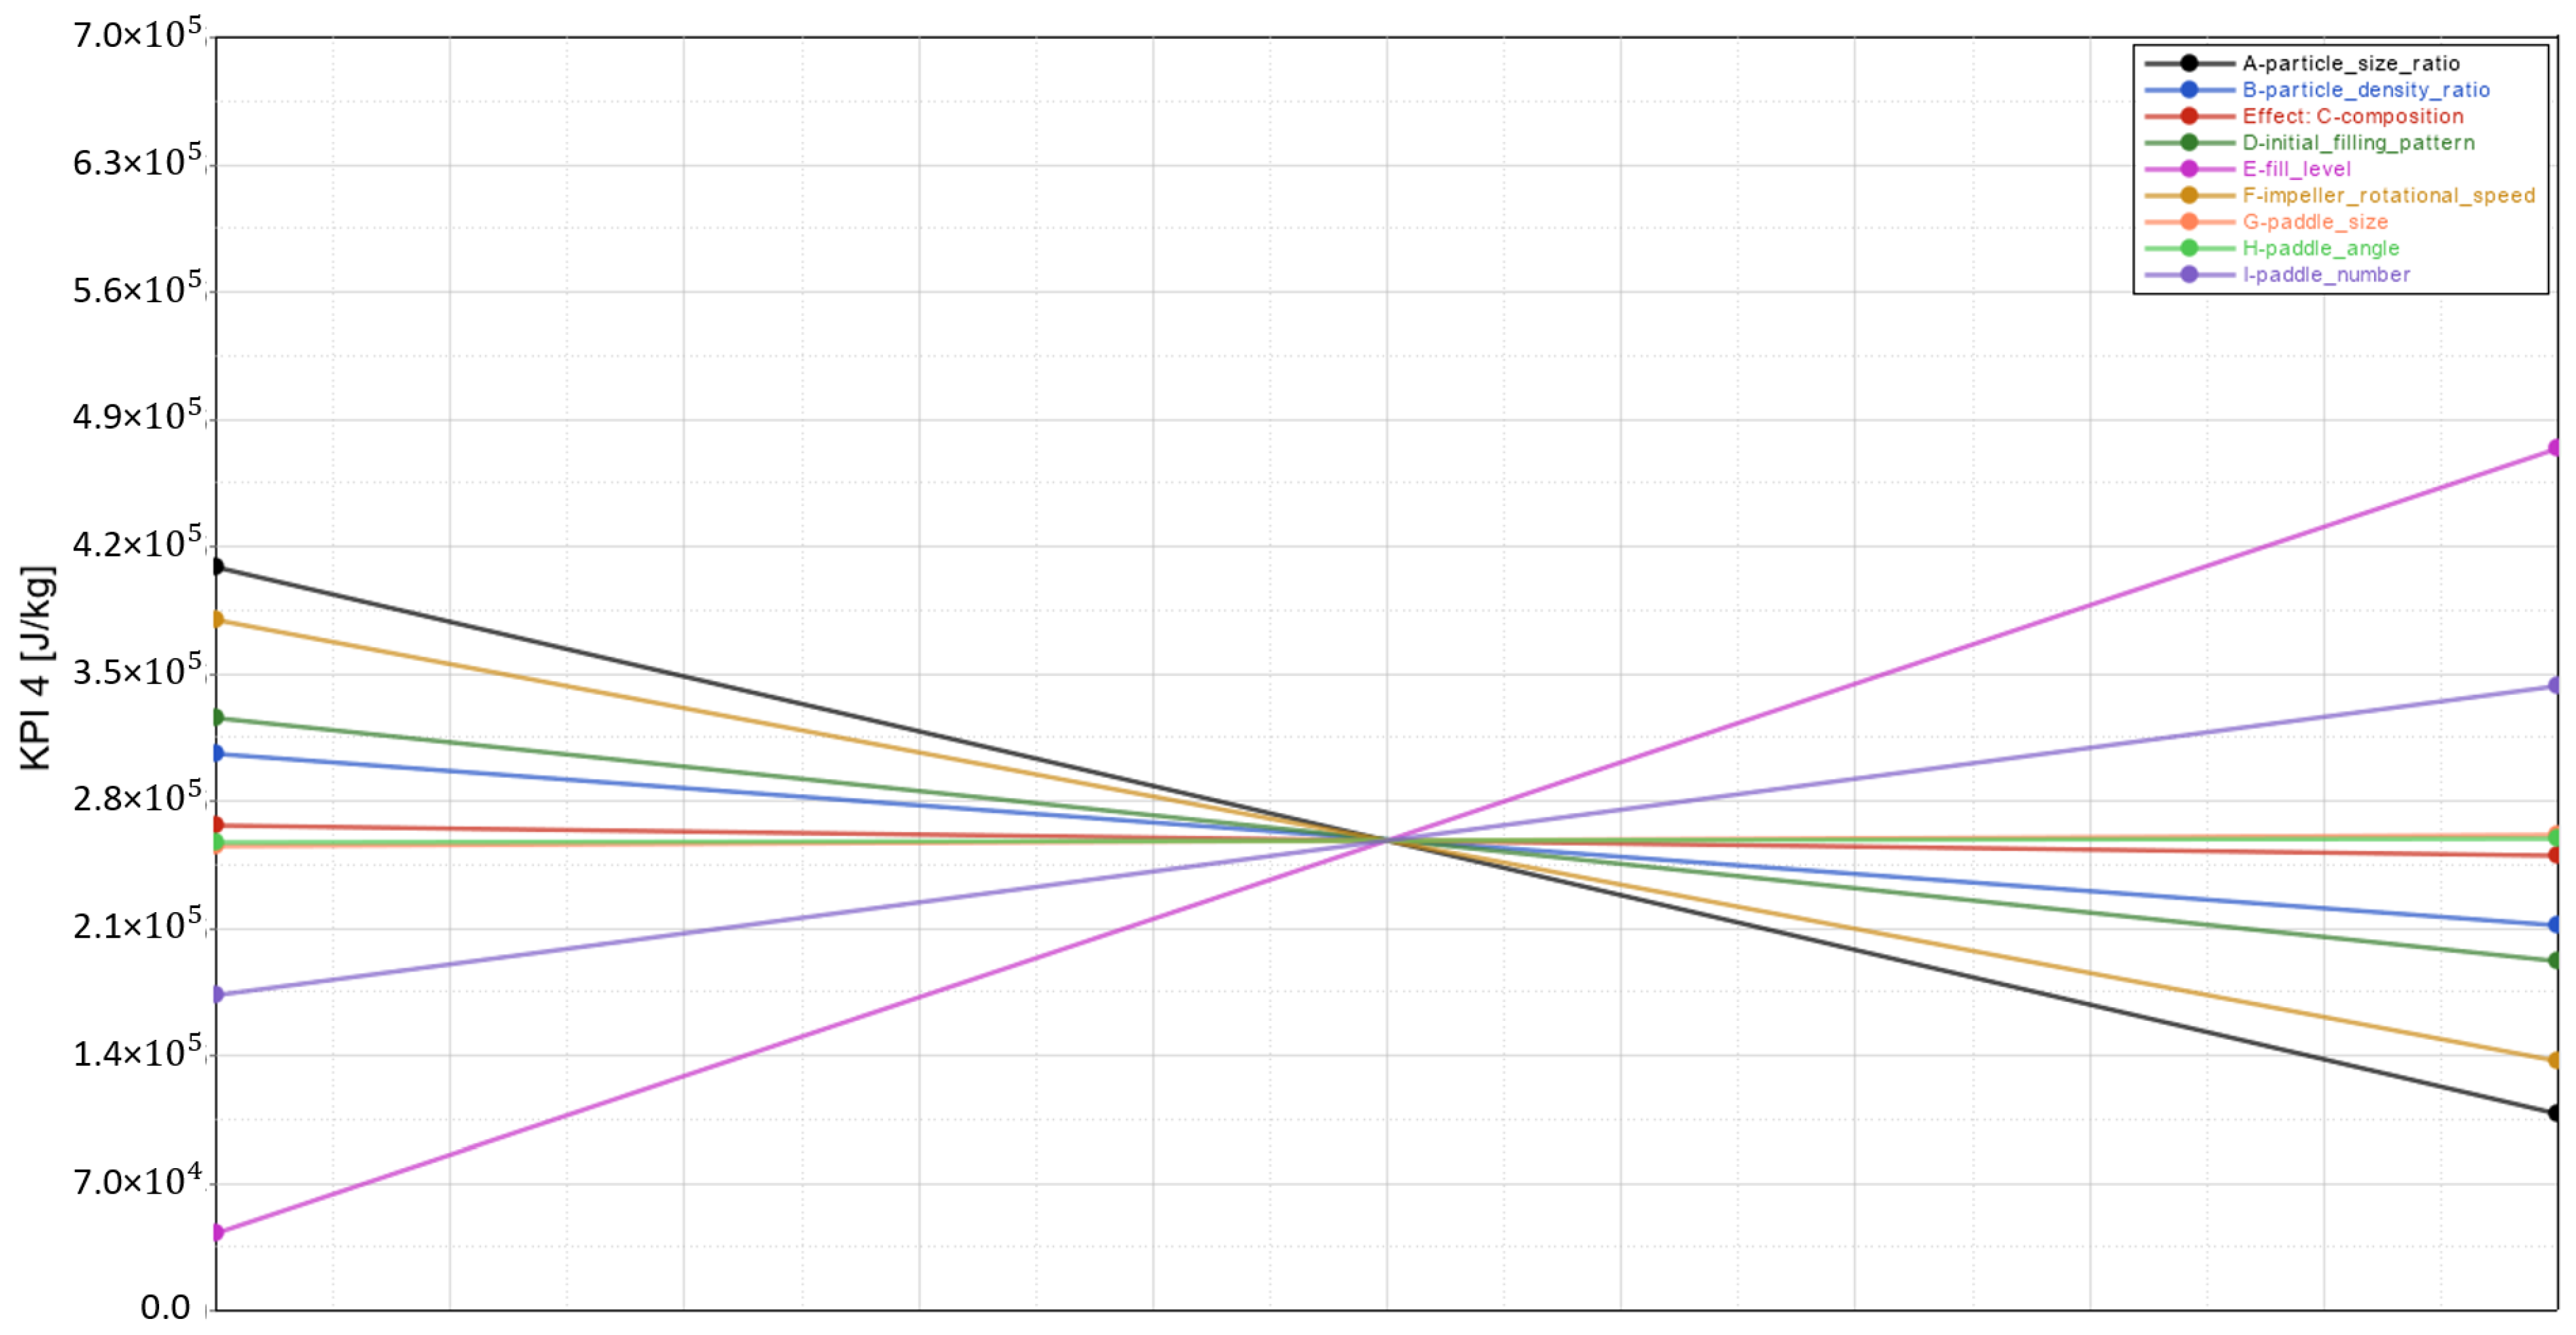
KPI 4 represents the total mixing energy and is defined as a multiplication of KPI 2 (mixing time) and KPI 3 (average mixing power). It was formulated this way to examine how much energy is consumed to reach a steady-state RSD, which is becoming an increasingly important factor in the mixing process. The results of the P–B design for KPI 4 are shown in Figure 12 and Table 9.
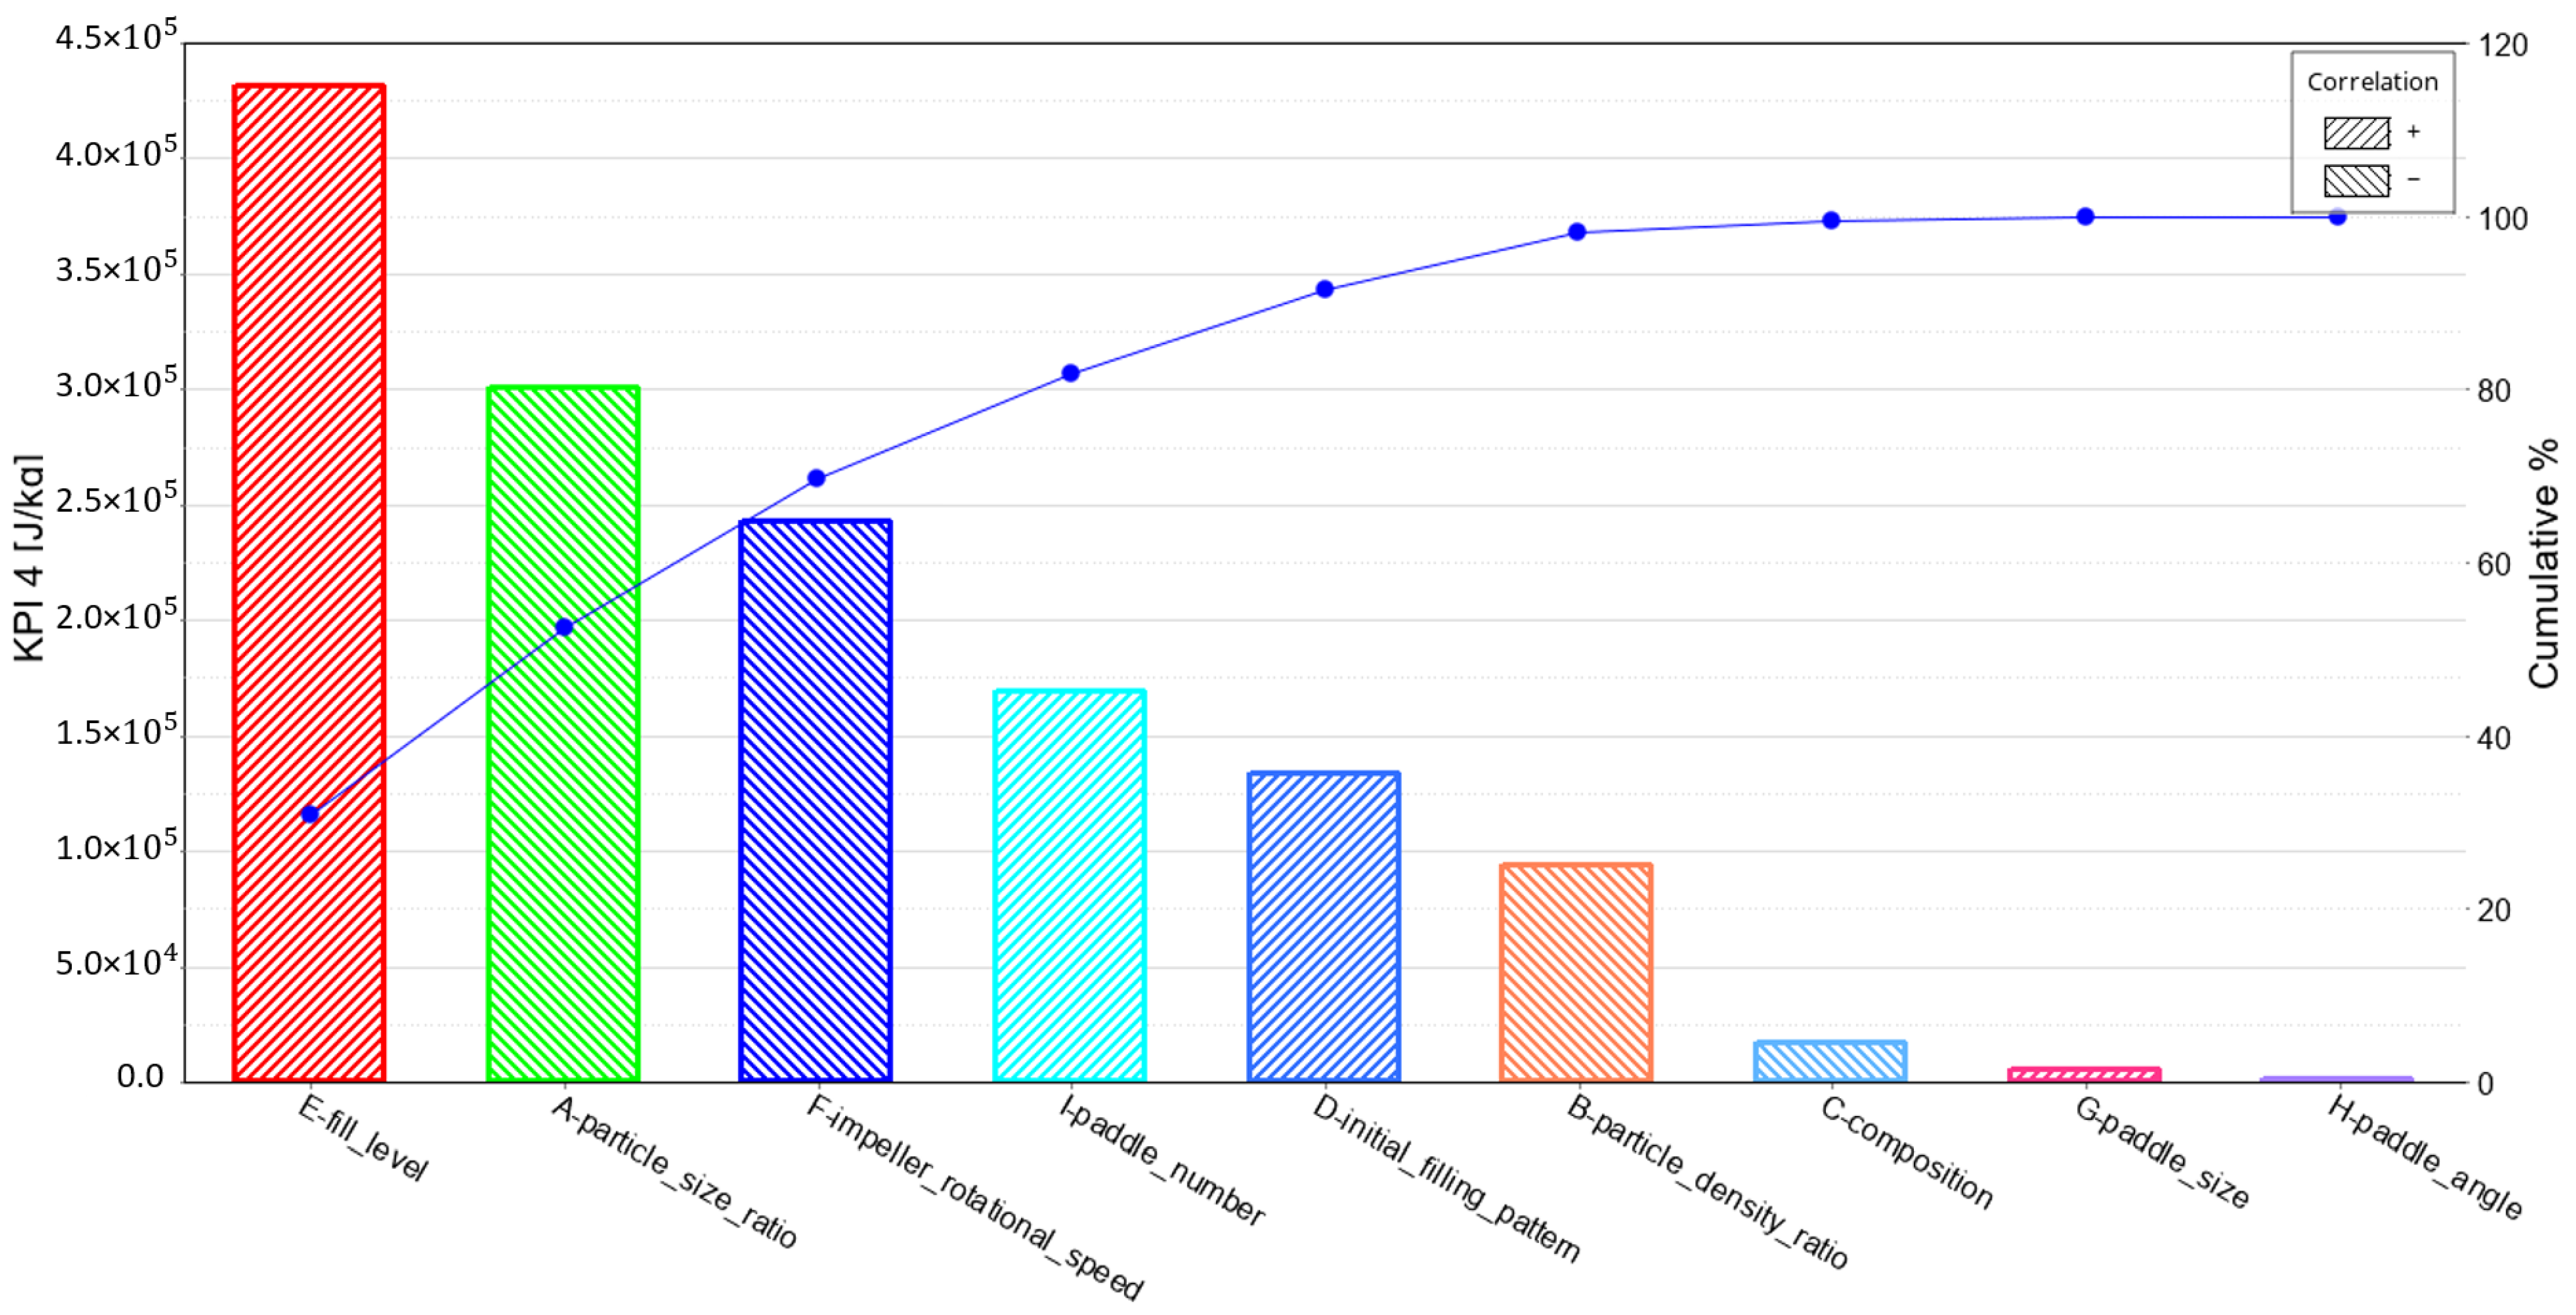
Table 9. Analysis of variance (ANOVA) results of KPI 4 total energy consumption.
| Factor | Description | Sum of Squares | F-Value | p-Value | Order of Significance |
| A | Particle size ratio | 2.72 × 10¹¹ | 5.7354659 | 0.1389247 | 2 |
| B | Particle density ratio | 2.66 × 10¹⁰ | 0.5605637 | 0.532109 | 6 |
| C | Composition | 8.82 × 10⁸ | 0.0186198 | 0.9039582 | 7 |
| D | Initial filling pattern | 5.38 × 10¹⁰ | 1.1366536 | 0.3980218 | 5 |
| E | Fill level | 5.59 × 10¹¹ | 11.794572 | 0.0753296 | 1 |
| F | Impeller rotational speed | 1.77 × 10¹¹ | 3.7405109 | 0.1927832 | 3 |
| G | Paddle size | 9.37 × 10⁷ | 0.0019783 | 0.9685645 | 8 |
| H | Paddle angle | 7.52 × 10⁴ | 0.000159 | 0.9910893 | 9 |
| I | Paddle number | 8.62 × 10¹⁰ | 1.8188166 | 0.3098714 | 4 |
| Total | 1.27 × 10¹² | ||||
| R2 = 0.9253936 | |||||
As can be seen, the fill level shows the most contribution to the amount of energy required to reach a steady state. In addition, although KPI 3 and KPI 4 are similar, as both deal with energy consumption, the order of significance of factors for KPI 4 is very different from that for KPI 3. This is because in KPI4, besides the mixing energy, the mixing time has also been considered. An interesting observation was that by increasing the impeller rotational speed from 40 to 80 rpm, the amount of energy required to reach the steady-state RSD decreases (Figure 13). This can be explained by the fact that the impeller rotational speed has an opposing effect on KPI 2 (mixing time) and KPI 3 (mixing energy), and it can be concluded that its effect on KPI 2 is more pronounced. Additionally, it can be seen that in both cases, the mixing energy and mixing time are of interest for optimization, the geometric parameters (i.e., paddle angle and paddle size) have a negligible effect and operational conditions such as fill level and impeller rotational speeds should be focused on.
3.5. Summary of Results of the P–B Design
The factors investigated from three different groups (material properties, operational conditions and geometric parameters) show distinctive behaviour depending on the response variable. In Table 10, a summary of all results is presented. It should be noted that the statistical significance of a factor (p < 0.1) is indicated by three pluses/minuses. A lower number of respective symbols (two or one) denotes the factor’s order of significance.
Table 10. Summary of factor response. Pluses (+) and minuses (−) indicate positive and negative correlations, respectively. The number of pluses and minuses indicates the factor’s significance, e.g., (+++), (++) and (+) indicate p < 0.1, 0.1 ≤ p < 0.2 and p ≥ 0.2, respectively.
| actor | Description | KPI 1 [-] | KPI 2 [s] | KPI 3 [W/kg] | KPI 4 [J/kg] |
| Mixing Quality | Mixing Speed | Normalized Average Power | Total Energy Consumption | ||
| A | Particle size ratio | + | − − | − | − − |
| B | Particle density ratio | + | − | − − | − |
| C | Composition | + | − | − − − | − |
| D | Initial filling pattern | + | + | + + + | + |
| E | Fill level | − − | + + | + | + + + |
| F | Impeller rotational speed | − − | − − | + + + | − − |
| G | Paddle size | − | − | − − − | + |
| H | Paddle angle | + + + | + | − − − | + |
| I | Paddle number | − − | + | + + + | + |
3.6. Granular Temperature
The granular temperature results for the three specified locations in the paddle mixer are shown in Table 11.
| Run | KPI 2 (s) | Loc_1 (K) | Loc_2 (K) | Loc_3 (K) |
| 1 | 8 | 0.2552 | 0.03783 | 0.1722 |
| 2 | 26.8 | 0.0145 | 0.00231 | 0.0016 |
| 3 | 7.6 | 0.1074 | 0.02129 | 0.13 |
| 4 | 140 | 0.0049 | 0.00127 | 0.0018 |
| 5 | 7.8 | 0.222 | 0.01209 | 0.1509 |
| 6 | 5.8 | 0.0385 | 0.00674 | 0.332 |
| 7 | 50 | 0.0037 | 0.00109 | 0.0007 |
| 8 | 10.8 | 0.0469 | 0.06964 | 0.1496 |
| 9 | 9 | 3.8086 | 0.06466 | 1.1007 |
| 10 | 40 | 0.0777 | 0.00396 | 0.0044 |
| 11 | 100 | 0.0026 | 0.00056 | 0.0006 |
| 12 | 8.4 | 0.8287 | 0.14147 | 0.1706 |
First, for almost all runs it can be observed that the granular temperature is higher in the centre (Loc_1) of the mixing chamber (also called the fluidized zone) compared to the bottom locations (Loc_2 and Loc_3). This observation confirms the expected trend where the particulate behaviour is mostly dynamic at the fluidized zone being formed between two paddles. Second, Loc_2 exhibited the lowest granular temperature in nearly all cases. This is due to the quasi-static state of the granular material before being thrown into the fluidized zone of the mixing chamber. Third, it can be observed for the fluidized zone of the mixing chamber (Loc_1) that the granular temperature can be related to the mixing time (KPI 2) of the paddle mixer. For instance, run 4 and run 11, which are characterized by a very long mixing time, have a very low granular temperature compared to other runs. Thus, a low diffusive behaviour of particles in the fluidized zone affects the mixing time in a negative way.
4. Conclusions
In this study, the discrete element method (DEM) and Plackett–Burman (P–B) design were used to investigate the mixing performance of a double paddle mixer. To this end, several material properties (i.e., particle size ratio, density ratio and composition), operational conditions (i.e., filling pattern, fill level and impeller rotational speed) and geometric parameters (i.e., paddle size, angle and number) were examined. In order to quantitatively analyse their effects on mixing performance, a number of key performance indicators (KPIs) were defined, namely the average steady-state RSD (KPI 1), the mixing time (KPI 2) and the average mixing power (KPI 3). In addition, KPI 4 was formulated as a multiplication of KPI 2 and KPI 3 to examine the mixing time and energy consumption at the same time.
- • Taking all KPIs into account, it can be generally concluded that material properties in the range investigated here do not significantly influence the mixer performance. In other words, when a mixer is well-designed, it will perform equally well in the range of material properties explored in this work. Nevertheless, it was found that a 50/50 volume ratio between components 1 and 2 needs less average mixing power (i.e., KPI 3) compared to an 20/80 composition.
- • Increasing the fill level enhances the mixing quality, but at the same time sacrifices a fast mixing time and a low total energy consumption. In addition, an increase in the impeller rotational speed leads to a mixing quality improvement, higher mixing time and lower total energy consumption. In short, a lower fill level in combination with a high rotational speed could lead to improved mix qualities, achieved in a faster and more sustainable way.
- • With respect to geometric parameters, the paddle angle is the most influential, where a decrease in the paddle angle significantly improves the mixing quality without compromising the mixing time or total energy consumption. Additionally, the paddle number seems to affect the mixing quality, but more research is required to confirm the aforementioned relation.
- • While increasing the paddle size significantly decreases the energy consumption, it does not greatly affect the mixing quality and mixing time, meaning that this factor holds great potential to be optimised for both efficient and sustainable double paddle mixers.
- • A granular temperature analysis showed an interesting relation between mixing time (KPI 2) and diffusivity in the fluidized zone of the paddle mixer. It was found that the mixing time is affected negatively when the fluidized zone is characterized by a low diffusive mixing mechanism.
- • Overall, one should focus on operational conditions and geometric parameters when all the KPIs, including the mixing quality, mixing time and energy consumption, are of interest for the purpose of process optimisation.
It should also be noted that due to the high number of factors studied in this work, the P–B design was used, which has the drawback of neglecting the interactions between factors. Additionally, when using a P–B design with two factors, one of the assumptions is that the behaviour of the system between the two levels is linear, which is often not the case, as shown in [33]. Therefore, it is recommended to explore the factor space with at least three levels to capture possible non-linear behaviour. Additionally, it is worthwhile to focus on the operational conditions and geometric parameters in future work to further optimise the mixing process.
Emmerink, J., Hadi, A., Jovanova, J., Cleven, C., & Schott, D. L. Parametric Analysis of a Double Shaft, Batch-Type Paddle Mixer Using the Discrete Element Method (DEM). Processes, 11(3), 738. https://doi.org/10.3390/pr11030738
© 2023 by the authors. Licensee MDPI, Basel, Switzerland. This article is an open access article distributed under the terms and conditions of the Creative Commons Attribution (CC BY) license (https://creativecommons.org/licenses/by/4.0/).

