The Behavior of Direct Reduced Iron in the Electric Arc Furnace Hotspot (2)
Figure 3 shows the voltage as a function of the current for all tests. The different point clouds represent stability regions from different controlling ranges. The more concentrated the points in the diagram are, the more stable the arc is. Since only minor fluctuations could be observed, arc operation was relatively stable in all cases. Nevertheless, the violet Test 3 with the DRI fines shows the broadest range, while the green Test 4 dots are relatively closely distributed. That confirms the arc-stabilizing effect of a slag layer on top of the melt.
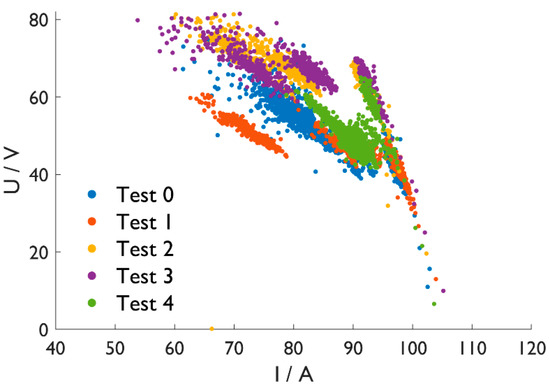
Figure 3. Voltage (U) vs. current (I) diagram.
All relevant furnace parts, the crucible, and the sample materials were weighed for a mass balance. All balances are negative, with Test 2, C-DRI, having the largest mass loss through the gas phase. During this test, 27.0 g dusted and evaporated from the furnace chamber without becoming separated in the off-gas filter. Further, the reduction reactions influence the mass balance in this case. That was the least pronounced at Test 4 with the slag cover and only 2.8 g loss. Tests 1 and 3 are in the middle, with—11.3 and—14.9 g, respectively.
Figure 4 shows in situ photographs during the carbon and slag-free Tests 1 and 3. The electric arc moves over the surface and melts the sponge iron. The pellets in Figure 4a offer a contrast to describe the progress better. A liquid pool is on the left-hand side, while a pellet structure can still be observed on the right side. In contrast, the DRI-fines in Figure 4b do not show any contours, making a detailed observation difficult.
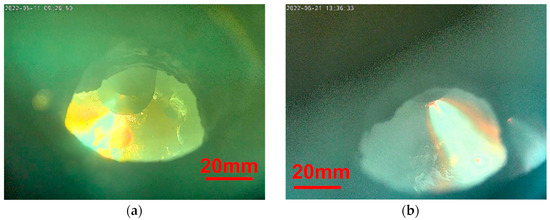
Figure 4. In situ photographs. (a) Test 1; (b) Test 3.
The formation of bubbles characterizes the carburized sample in Figure 5; see the red circle. These blisters indicate a reduction in residual iron oxide with carbon in the sponge iron sample.
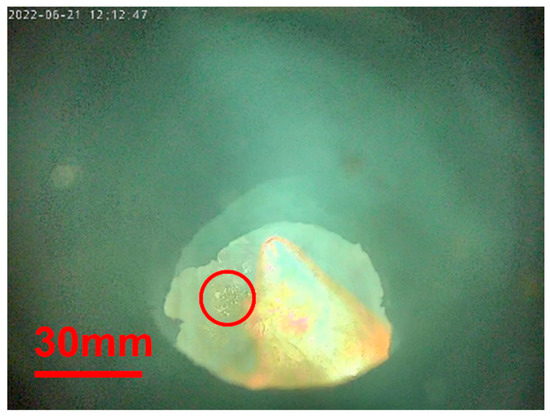
Figure 5. In situ photograph during Test 2.
The dissolution of slag-forming oxide can be observed in Figure 6. The photograph in (a) was taken directly after the addition of powder. In (b), the powder dissolves in the superficial slag layer; see the red circled spot. After charging the oxide powder in (c), the whole surface seems to glow. That differs from the other samples in which the intensive cooling effect through the steel crucible leads to a localized hot spot. This appearance demonstrates the insulating effect of the slag layer.
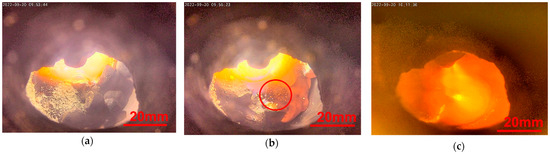
Figure 6. In situ photographs during Test 4 (a) with oxide powder on top; (b) dissolution of oxide powder; (c) after all slag formers are charged.
Figure 7 shows the off-gas analysis of Test 2 with carburized DRI. The high CO and CO2 amounts indicate a reduction in residual iron oxide, confirming the observation above. The carbon content of 0.75%, which significantly decreased from the DRI, correlates with the result. A further striking aspect is the increasing hydrogen amount resulting from moisture in the furnace refractory. The higher the temperature, the more moisture is released, which reacts to H2 and CO after the heterogeneous shift reaction.
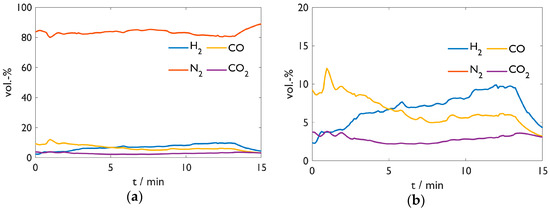
Figure 7. Off-gas analysis of Test 2. (a) Overview; (b) detailed y-scale.
Figure 8 provides the off-gas analysis of Test 3 with the DRI fines. H2 shows an analogous behavior as above; CO and CO2 result from electrode burn-off as the sample contains no carbon. Unfortunately, the analysis of Test 1 was lost due to a software issue. Nevertheless, Figure 8 is representative of exhaust gas compositions of the carbon-free samples in Tests 1, 3, and 4. Sample 3 remained almost carbon-free with 0.09%, which may have resulted from interactions with the steel crucible or the graphite electrode.
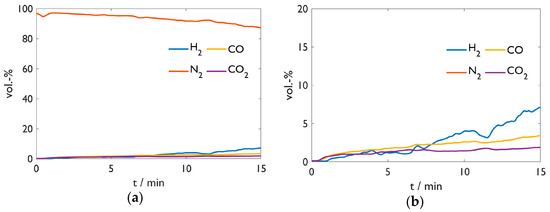
Figure 8. Off-gas analysis of Test 3. (a) Overview; (b) detailed y-scale.
Figure 9 shows the sample crucibles after the tests. Red dust settles superficially. The most plausible explanation is the formation of iron oxides or hydroxides from the vaporized Fe with moisture from the furnace refractory. That aligns with the slag-covered sample in (d). On the one hand, it shows a primarily grey color; on the other hand, this sample evaporated the least. While the samples in (a) and (b) present a rough surface, the slag layer in (d) is relatively smooth but brittle with many cracks. This layer’s dark grey color indicates a high amount of iron oxide. Tests 1 and 3 imply a formation of a concentric structure from the temperature gradient around the electric arc.
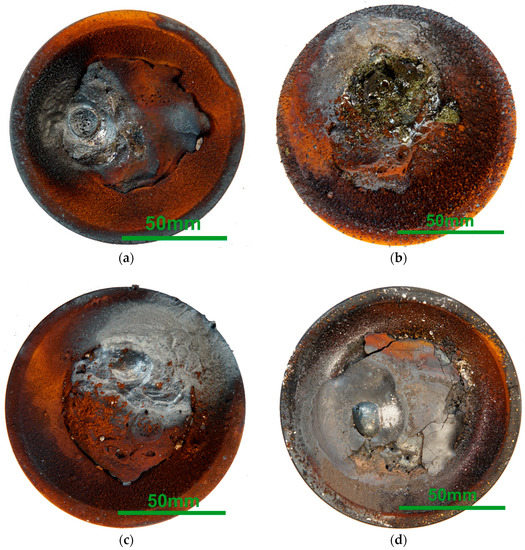
Figure 9. Macroscopic photographs of the sample crucibles after the tests. (a) Test 1; (b) Test 2; (c) Test 3; (d) Test 4.
Looking at the carburized DRI sample from Test 2 in (b), two aspects catch the eye. Firstly, lots of droplets cover the crucible on the lower right-hand side. Secondly, the sample surface appears less metallic but somewhat yellowish and glassy. A possible explanation for this appearance may be that CO blisters from reduction reactions splash out metallic droplets. These droplets arrive on the crucible surface. Further, the blisters drag the gangue onto the surface of the sample. The splashes also explain the pronounced mass loss, as some could land in the furnace refractory without being noticed.
Figure 10 shows the top layer particle from Test 2 as a digital microscope image from the upper and lower side. While (a) looks metallic with many blisters, (b) seems glassy.
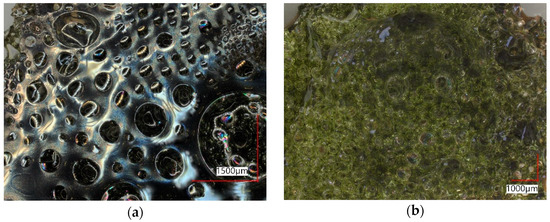
Figure 10. Top layer of Test 2. (a) lower side; (b) upper side.
Table 3 provides the approximate composition of the mentioned particle from both sides, determined by SEM-EDX. Although the iron oxide content in the lower part is slightly higher, the compositions do not differ significantly. The shiny gray color indicates that it is partly metalized. Nevertheless, SEM-EDX does not provide the possibility to differentiate between Femet, Fe2+, and Fe3+.
Table 3.Chemical composition of Test 2 top layer from Figure 10, determined by SEM-EDX as elements and recalculated as oxides.
| wt.-% | FeO | MnO | SiO2 | Al2O3 | CaO | MgO | TiO2 |
| Lower side | 16.9 | 9.33 | 36.3 | 7.4 | 19 | 9.57 | 1.55 |
| Upper side | 14.3 | 9.19 | 38.3 | 7.77 | 19.7 | 9.16 | 1.58 |
Figure 11 shows the digital microscope images of the cross-sections. The following aspects are noticeable:
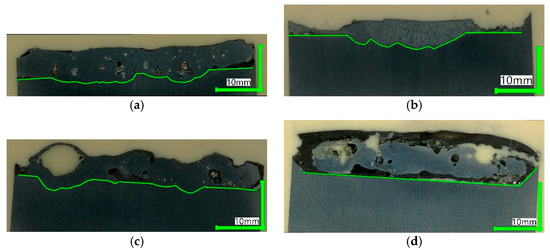
Figure 11. Digital microscope images of cross-sections. (a) Test 1; (b) Test 2; (c) Test 3; (d) Test 4.
The carbon-free samples from Tests 1, 3, and 4 show numerous pores, especially for the fine-DRI sample in (c), with one big blister. Further, they contain dark spots indicative of gangue inclusions.
The carbon-bearing sample in (b) looks completely different in this case. It forms a dense structure without pores and inclusions. This behavior correlates with the macroscopic observations and the gangue being agglomerated and collected on the sample top.
Samples in (a), (b) and (c) are merged with the crucible. The opposite is the case in (d). The slag frames the steel; the straight borderline indicates the absence of liquefying of the crucible. This picture is even more striking since the crucible center appears enriched with slag; compare the cutting scheme in Figure 2.
4. Discussion
Small-scale melting tests were performed with different DRI types in the HPSR reactor in the EAF operation. The stable electric arc confirms the good fusibility of all DRI samples. That is especially true if the furnace is operated with a slag layer, leading to little electrical fluctuations, highlighted in the stability areas of Figure 3.
All mass balances are negative, indicating extensive evaporation and dust losses into the furnace chamber without becoming separated in the off-gas filter. That is the most pronounced for the carbon-bearing sample in Test 2. The larger droplets on the steel crucible, visible in Figure 9b, suggest a second effect. CO bubbles from the reduction in residual FeO splash out of the melt into the furnace chamber, carrying liquid droplets. Therefore, this mass loss is not considered in the mass balance. The high CO amount in the off-gas and the low final carbon content of 0.75% indicate significant reduction of residual iron oxide in the DRI.
Test 2 also stands out in another way. The cross-section is free of blisters and gangue inclusions. The gangue accumulates on the surface. This appearance indicates a purifying effect of the CO bubbles in terms of gases and entrapments; the remaining carbon could enhance this effect by lowering the melt viscosity.
Test 4 demonstrates the critical influence of slag on the melting process. Besides the thermal insulation effect, the slag also avoids evaporation and dust losses and stabilizes the electric arc slightly. Further, this test demonstrates bath stirring, possibly from electromagnetic forces. While the melt in all other tests merges with the crucible, this is not true in Test 4.
Combining these observations with findings from previous studies, we can explain the crucial importance of the DRI feeding point. For fast DRI melting, a contact between pellet and steel melt is essential. In the arc center, intensive bath stirring happens. Consequently, besides the high temperature, this mixing effect increases the chance of DRI contacting crude steel, increasing its melting rate. Higher carbon content can further enhance that in the melting stage, which can be decreased during refining before tapping.
5. Conclusions and Outlook
This study demonstrates the importance of the DRI feeding point into the electric arc hotspot. It is not only the high temperature but also the electromagnetic stirring mechanism that leads to an increased chance of DRI contacting the liquid steel and forcing convective heat and material diffusion. Test 4 with slag-forming oxides demonstrates this effect by the formation of a slag layer which covers the steel sample. The slag layer also slightly stabilizes the arc, insulates the bath thermally and prevents severe evaporation.
An increased carbon content during the charging and melting stage seems to be further beneficial. As previous studies show, melting is faster with carbon. Besides that, Test 2 with carbon-bearing DRI suggests that a cleaning effect from the CO bubbles can be expected, which benefits the final crude steel quality. This effect is evident in two respects. On the one hand, the structure of Test 2 appears free of blisters, and on the other hand, the gangue oxides are deposited on the surface instead of being finely dispersed. Last but not least, the fact that more than half of the carbon reacted with residual oxides indicates a high reactivity of carbon in DRI.
In a nutshell, the optimal conditions based on these experiments would be as follows: a highly carburized DRI that is fed directly into the electric arc hot spot. There, the pronounced stirring effect of the electric arc provides the optimal conditions for sponge iron melting. As the sample from carbon-free DRI shows blisters and entrapments, besides the charging spot, the hot heel operation in the EAF also demands critical consideration.
The results are a first step for possible future experiments with this method. Interesting topics could be the comparison of different prereduction states, continuous feed of fine DRI, or quantification of the results by using energy balances and calculating melting rates.
© 2023 by the authors. Licensee MDPI, Basel, Switzerland. This article is an open access article distributed under the terms and conditions of the Creative Commons Attribution (CC BY) license (https://creativecommons.org/licenses/by/4.0/).